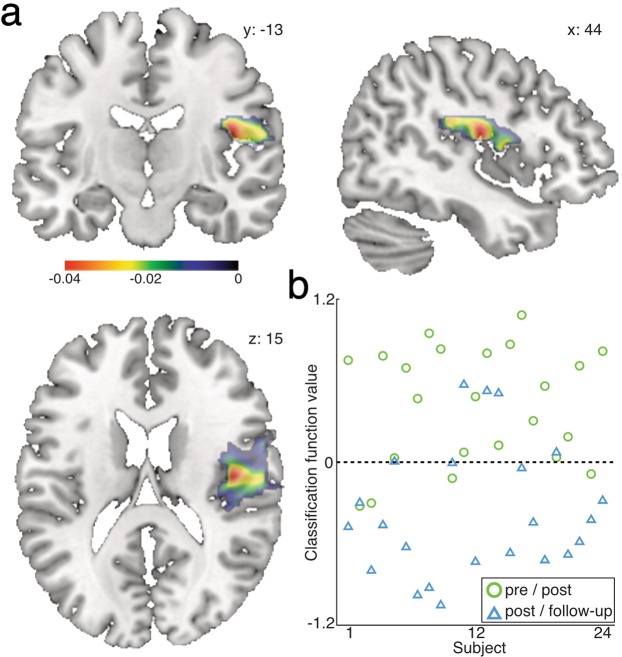
Figure 5.
Multivariate pattern classification analysis. (a) The weight maps for the area with the greatest predicted power (weight: 72%) is located in the right pars opercularis and the rSTG. Maps are computed by means of a multiple-kernel learning machine based on a pre-parcellated atlas (Automatic Anatomic Labeling) (b) Results for the support vector machine classification are shown in the scatter plot. The balanced accuracy is 80.43%. Functional values are plotted for each participant for the learning-period (triangle) and the post-learning period (circle). See also Supplementary Table S1 and Supplementary Fig. S1.

