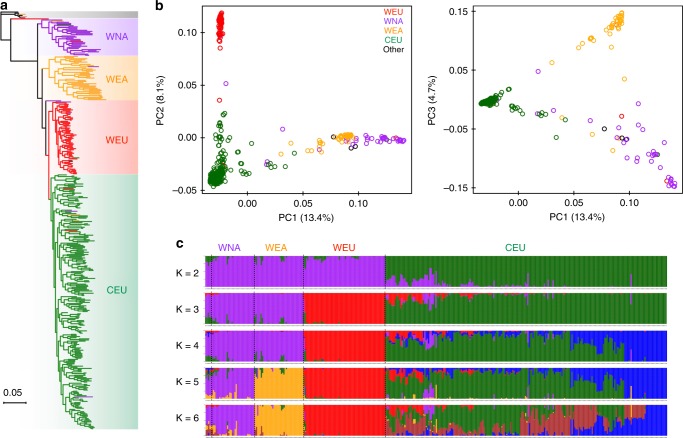
Fig. 2.
Phylogeny and population structure of major Vitis categories. a Maximum likelihood phylogenetic tree of grapevine accessions inferred from the whole-genome SNPs with 100 nonparametric bootstraps (see Supplementary Fig. 3 and 4 for bootstrap values as blue circles). Parthenocissus tricuspidata (Boston ivy) was used as an outgroup. b PCA plots of the first three components of major Vitis accessions using whole-genome SNP data. c Population structure of major Vitis categories estimated by ADMIXTURE. Each color represents one ancestral population. Each accession is represented by a bar, and the length of each colored segment in the bar represents the proportion contributed by that ancestral population

