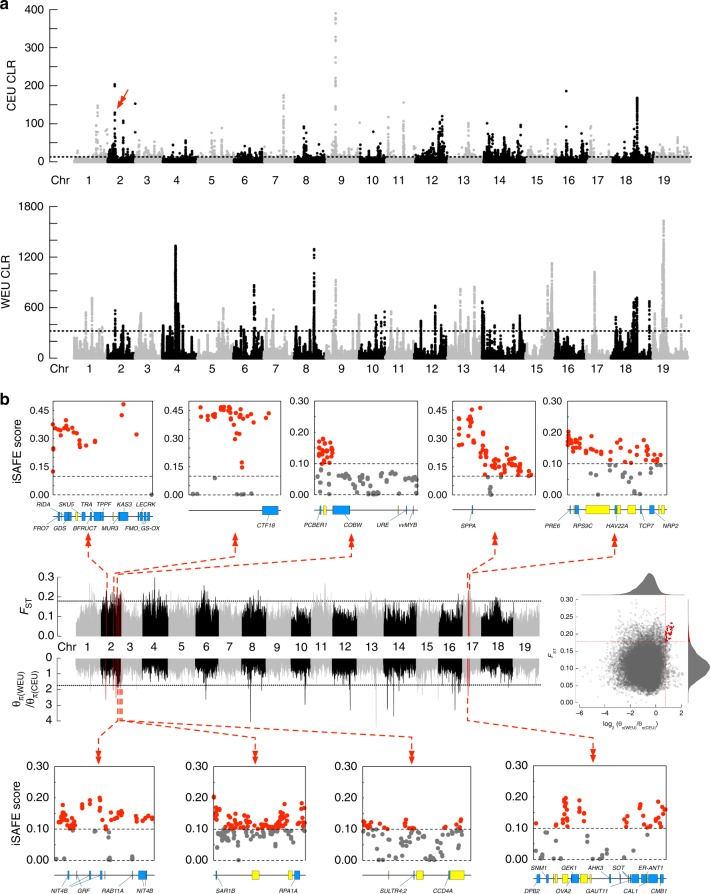
Fig. 6.
Selective sweep regions in the grapevine genome. a CLR scores calculated by SweeD across the genome in both wild European and domesticated grapevines. The dashed lines mark the regions at the top 0.5%. The red arrow indicates the putative sex determination region. b Selective sweep regions during domestication inferred from FST and π statistics and SNP hotspots in each region influenced by ongoing selection sweep. Each selective sweep region is represented by a red perpendicular line in the genome. Magnified view of each selective sweep region is represented by a horizontal line, on which annotated (blue blocks) and unknown (yellow blocks) genes are drawn. Each dot in the iSAFE plots represents the average iSAFE score for 36 SNPs (step size 18 SNPs) in the region. The dashed line shows the empirical significance cut-off. In the first iSAFE plot, this region overlaps with the putative sex determination region

