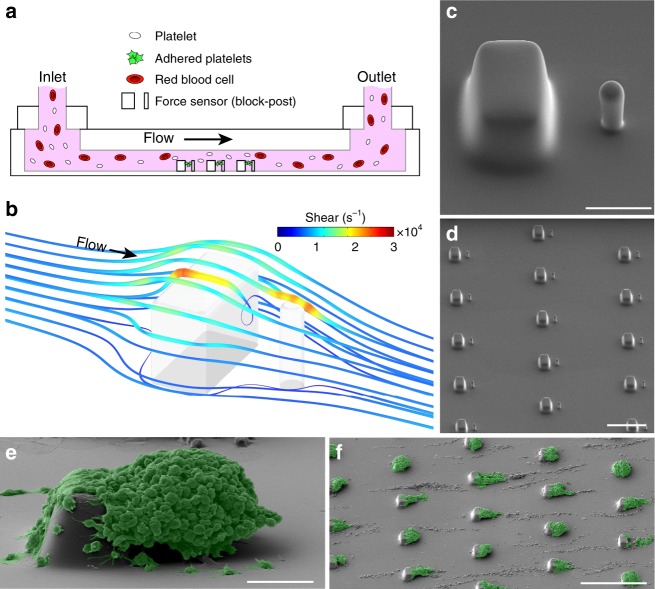
Fig. 1.
Microfluidic formation of platelet aggregates. a Schematic of microfluidic device in which whole blood is injected at the inlet and platelets aggregate onto arrays of microscale blocks and flexible posts for the measurement of platelet forces. b Computational fluid dynamics simulation at a wall shear rate of 8000 s−1 show local regions of high shear that platelets encounter as they follow the streamlines that transit over a block and post. c Scanning electron microscopy (SEM) micrograph of a block and post at the bottom of the microchannel. Scale bar, 10 μm. d SEM micrograph of an array of blocks and posts. Scale bar, 50 μm. Pseudo-colored SEM micrograph of platelet aggregates that formed on (e) a block and post (scale bar, 10 μm) and f on an array of blocks and posts (scale bar, 100 μm) after 70 s of blood flow in the device

