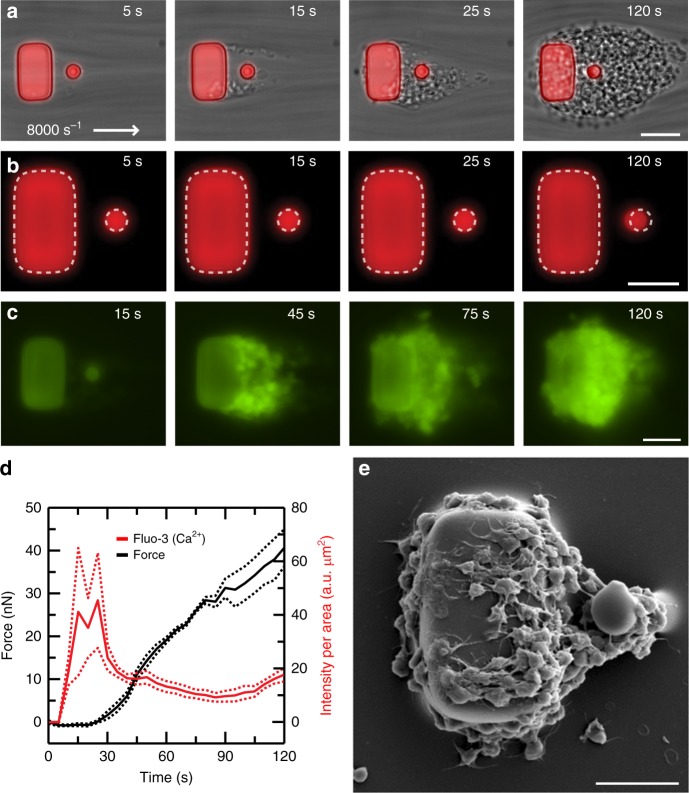
Fig. 2.
Measurement of platelet forces coincide with platelet activation. a Representative time course of phase contrast and fluorescence microscopy images taken during platelet aggregation at 8000 s−1. Platelets clump initially at the trailing edges of the block and then connect to the post, eventually recruiting more passing platelets to attach to the aggregate. Scale bar, 15 μm. b The block and posts are fluorescently labeled (red, DiI), which allows platelet forces to be measured by analyzing the deflection of the post over time. Multiple aggregates are measured in the same field of view of the camera and averaged together over time to obtain a data trace. Scale bar, 10 μm. c Using a fluorescence indicator of Ca2+ (fluo-3) shows that platelets exhibit increased intracellular calcium upon adhesion to the block. Scale bar, 10 μm. d Representative data from a single donor shows that Ca2+ concentration (red) increases prior to platelet forces on the posts (black). Solid lines indicate the mean and dashed lines indicate standard error of the mean. e Scanning electron microscopy (SEM) micrograph of a platelet aggregate formed after 45 s at 8000 s−1. Platelets attached to the block and post have undergone shear-induced activation and shape change. Scale bar, 10 μm

