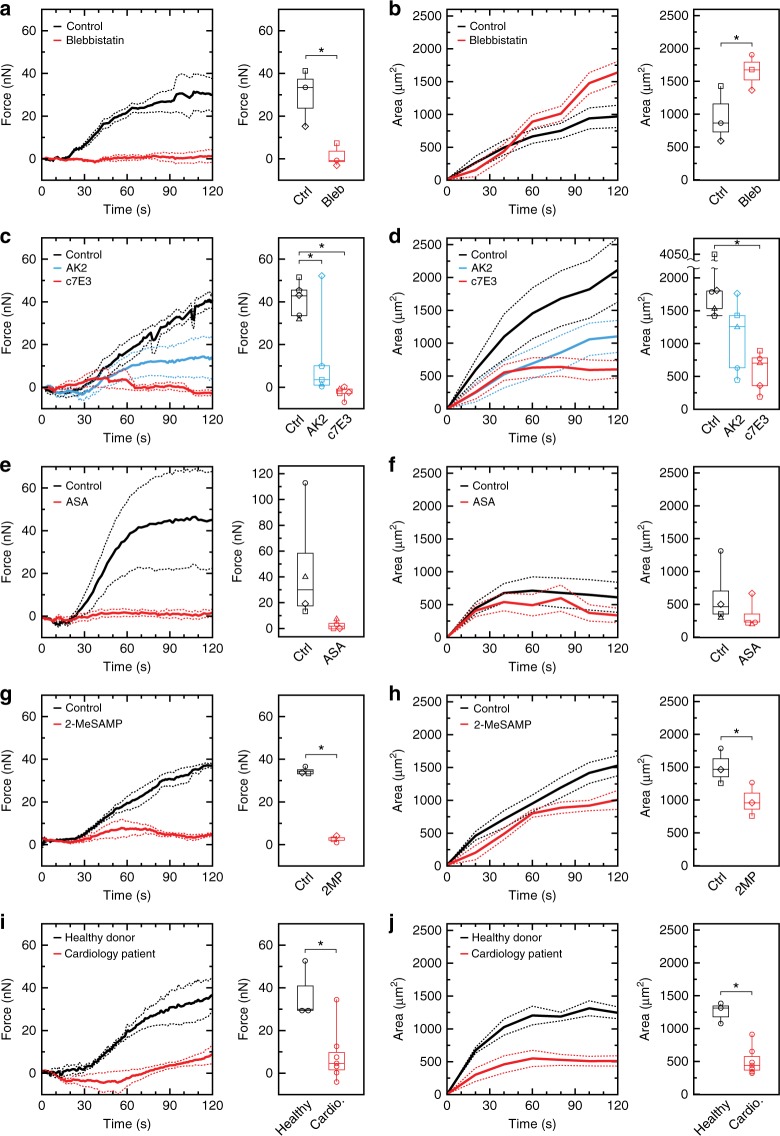
Fig. 3.
Platelet forces are sensitive to platelet inhibition. Forces and projected areas are shown for measurements of aggregates in the microfluidic device. Myosin inhibition (5 μM blebbistatin) causes a lower forces and b less compacted aggregates as compared to the control. Data are from three donors. Inhibition of GPIb-IX-V (5 μg mL−1 antibody AK2) or integrin αIIbβ3 (20 μg mL−1 antibody c7E3) causes a reduction in c platelet forces and d aggregate size. Data are from five donors. Inhibition of thromboxane formation using 0.3 mM acetylsalicylic acid (ASA) reduces e platelet forces and f aggregate size. Data are from four donors. Inhibition of adenosine diphosphate (ADP) activation (10 μM 2-MeSAMP (2-methylthioadenosine 5’-monophosphate triethylammonium salt)) reduces g platelet forces and h aggregate size. Data are from three donors. Cardiology patients on aspirin therapy have significantly reduced i platelet forces and j aggregate size as compared to healthy donors. Data shown are from seven cardiology patients and three healthy donors. Solid lines indicate the mean and dashed lines indicate standard error of the mean. Body of the box plots represent first and third quartiles. Center lines denote the median. Whiskers extend from the quartiles to the last data point within 1.5× interquartile range, with outliers beyond. Each marker shape in (a–h) represents control and inhibitor results for a blood sample from a single donor. Asterisks denote statistically significant differences (*p < 0.05) using paired two-way T-tests for (a, b, e–h), one-way analysis of variance (ANOVA) followed by Tukey’s post-hoc test for (c, d), and two-way unpaired T-tests for (i, j)

