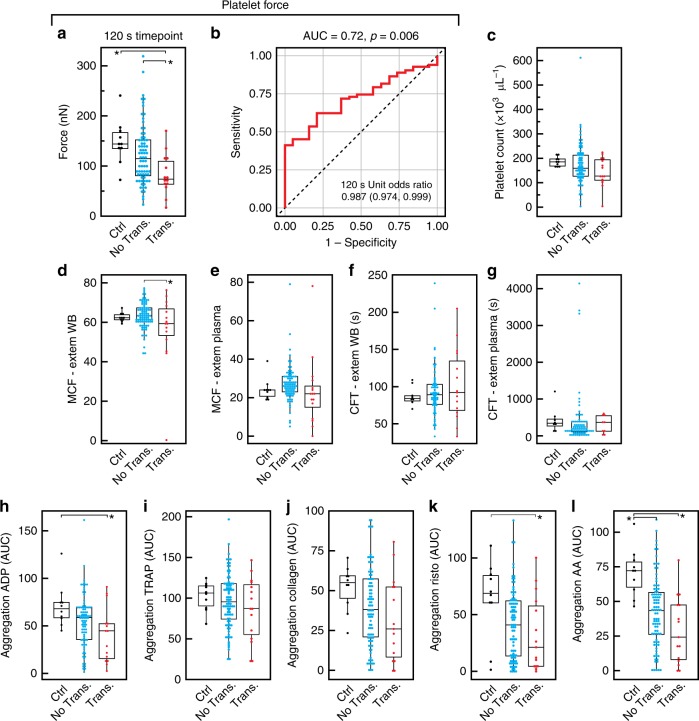
Fig. 4.
Platelet forces are indicative of bleeding risk in trauma patients. In a prospective cross-sectional observational study of Emergency Department trauma patients at a regional trauma center (N = 110 patients), blood was sampled upon arrival to the Emergency Department. a Platelet forces differed among healthy controls and trauma patients when stratified by need for blood product transfusion within the first 24 h of hospital care. Mean force was significantly decreased for those requiring transfusion (red diamonds) compared to both healthy controls (black diamonds) and vs. trauma subjects who did not require transfusion (magenta diamonds). b Receiver operating characteristics revealed that platelet forces significantly predicted the need for transfusion. c Platelet count was in the normal range for all three groups and was not different between groups. d, e Rotational thromboelastometry (ROTEM) showed that maximum clot firmness (MCF) was decreased in whole blood for transfused vs. not transfused trauma groups, but was not different between groups when measured in plasma. f, g There were no differences in ROTEM clot formation time (CFT) between groups when measured in whole blood and in plasma. h–l Platelet aggregation responses measured by the area under the aggregation curve (AUC) were significantly different when aggregation was activated by adenosine diphosphate (ADP), ristocetin, and arachidonic acid. There were no differences in aggregation between groups when activated by thrombin activating peptide (TRAP), or collagen. Platelet aggregation did not distinguish between transfused and non-transfused trauma patients. Body of the box plots represent first and third quartiles. Center lines denote the median. Whiskers extend from the quartiles to the last data point within 1.5× interquartile range, with outliers beyond. Data points represent results from a single subject. Asterisks denote statistically significant differences (*p < 0.05) using one-way analysis of variance (ANOVA) followed by Tukey’s post-hoc test

