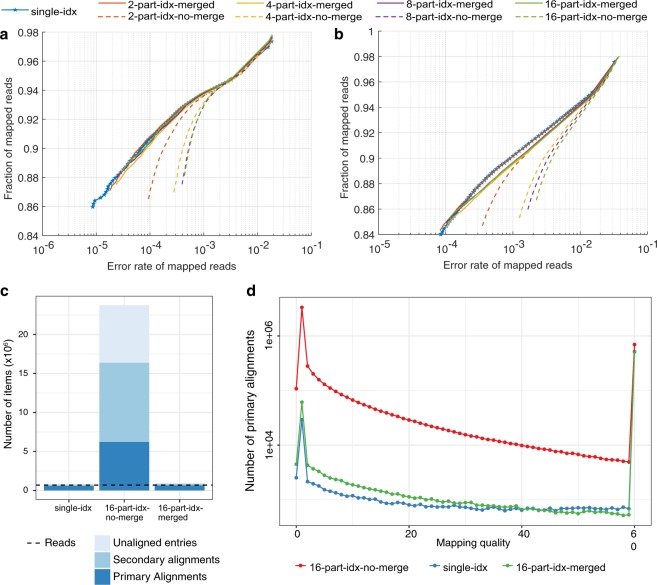
Figure 3.
Effect of using partitioned indexes versus a single reference index on alignment quality. (a) Base-level and (b) locus- or block-level alignment accuracy from synthetic long reads. The x-axis shows the error rate of alignments in log scale (see Materials and methods). The y-axis shows the fraction of aligned reads out of all input reads. Each point in the plot corresponds to a mapping quality threshold that varies from 0 (top right) to 60 (bottom left). These plots are akin to precision-recall plots with the x-axis inverted. (c and d) Alignment statistics for Nanopore whole genome sequencing data from NA1287814 using a 16-part index. (c) The number of total entries (primary + secondary + unaligned) for single-idx, 16-part-idx-merged, and 16-part-idx-no-merge, in log scale. The dotted horizontal line represents the number of reads. (d) Number of primary mappings in function of Minimap2 mapping quality (log scale).

