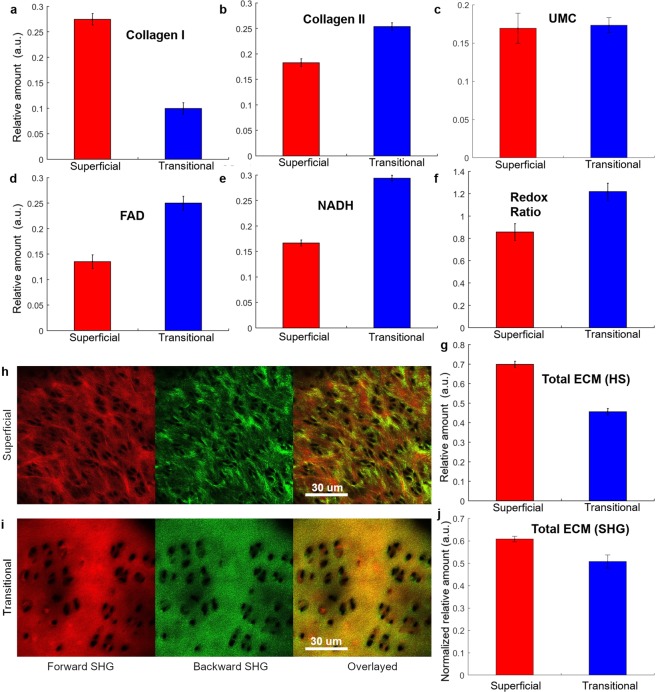
Figure 1.
Mean abundances of main autofluorescent components in superficial (red) and transitional (blue) layers of intact bovine articular cartilage (sample set 1–8). The bars represent the standard error from multiple samples (Supplementary Table S1). The extracted mean abundances of (a) collagen I, (b) collagen II, (c) unknown ECM component, UMC, (d) FAD, (e) NADH, (f) mean value of RR (FAD/NADH) and (g) total abundance of ECM obtained from hyperspectral imaging, calculated here as the sum of abundances of collagen I, collagen II and the fifth undefined fluorophore, likely to be also collagen or aggrecans. All values are calculated from mean abundances of extracted fluorophores. (h,i) Forward (first column) and backward scattered (middle column) SHG images for (h) superficial (upper row) and (i) transitional layers (bottom row) and the overlayed SHG images (third column). (j) Normalized mean abundance of total ECM in the superficial (red) and transitional layers (blue) derived from the SHG signal.

