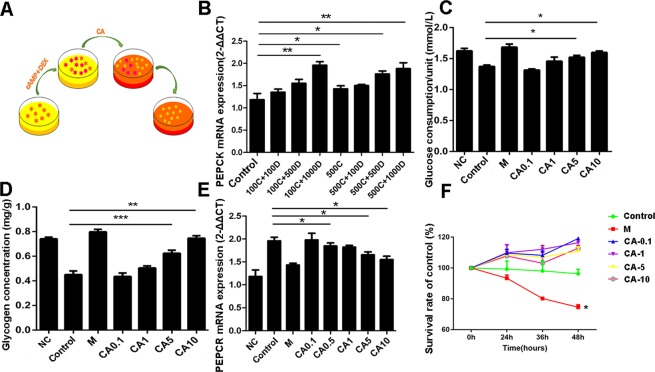
Figure 2.
CA improved glucose consumption and glycogen stimulate led by cAMP and DEX induced T2D cell model. (A) Model building schematic diagram; (B) PEPCK mRNA expression in different cAMP and DEX treated group; After CA treatment, glucose consumption (C), glycogen stimulate (D) and PEPCK mRNA expression (E) were analyzed; (F) Antiproliferative effect of CA on HepG2 cells were analyzed by CCK8. * Indicates a significant difference from the control at P < 0.05, **P < 0.01, ***P < 0.0001. C, cAMP; D, DEX; M, metformin.

