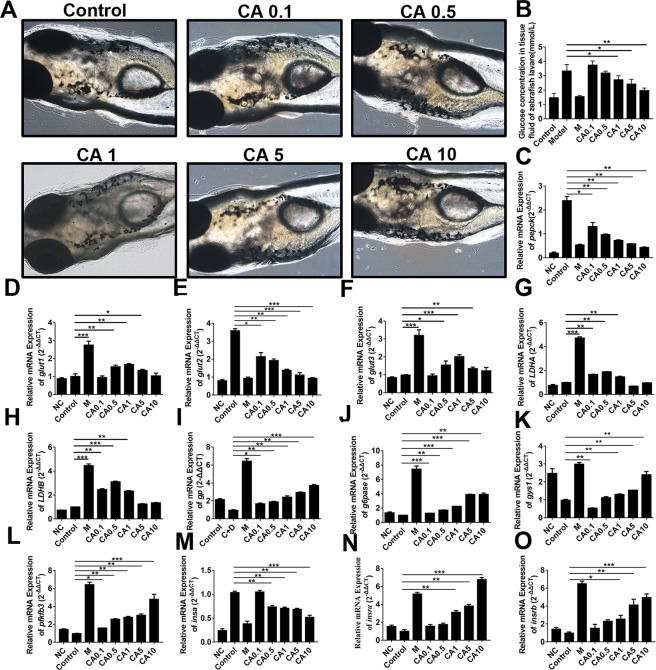
Figure 4.
CA reduced glycogen output in zebrafish model. (A) The toxicity of CA on zebrafish; (B) Glucose concentration in zebrafish tissue fluid treated by different dosages of CA; C-O, PEPCK, GLUT1, GLUT2, GLUT3, LDHA, LDHB, GP, GP6ase, GYS1, PFKFB3, INSα, INSRα and INSRβ mRNA expressions were analyzed by qPCR. P < 0.05, **P < 0.01, ***P < 0.0001. NC, negative control; Control, diabetic control; M, metformin.

