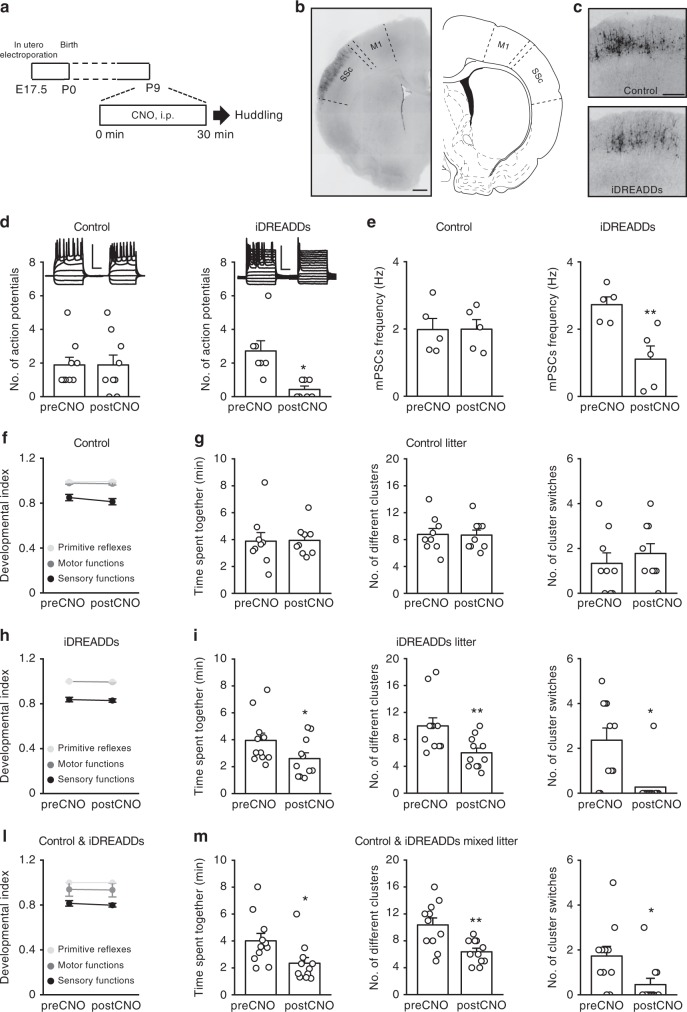
Fig. 3.
Huddling behavior depends on the activity of the somatosensory cortex. a Schematic depicting the experimental protocol. b Representative images of GFP fluorescence showing the expression of iDREADDs restricted to neurons of the somatosensory cortex (SSc) in in utero electroporation experiment (M1 is for primary motor cortex); image adapted with permission from the ‘Brain Maps Atlas 4.0’49. Scale bar: 400 µm. c Higher magnification of images as in b. Scale bar: 40 µm. d Single neuron data points and average mPSC frequency ± SEM for layer II/III neurons electroporated with iDREADD before and after CNO application (N = 7 for iDREADDs plus GFP and N = 9 for GFP-only controls; 4 animals). e Single neuron data points and average number of action potentials ± SEM (N = 5 for iDREADDs plus GFP and N = 5 for GFP-only controls, 6 animals), upon CNO administration. f, h, l Mean litter developmental index ± SEM for primitive reflexes (light gray) and motor (dark gray) and sensory functions (black) before and after CNO administration at P9 in litters electroporated in utero with control vectors (N = 9 litters, 90 animals total), iDREADDs (N = 11 litters, 110 animals total) and control and iDREADDs mixed litters with half of the pups electroporated with control vector and half of the pups electroporated with iDREADDs (N = 11 litters, 110 animals total). see also Supplementary Table 4 for descriptive values, Supplementary Fig. 3c for relative polar plots and Supplementary Fig. 6a. g, i, m Parameters describing the huddling behavior at P9 before and after CNO administration in the same sets of animals as examined in f, h, and l. See Supplementary Table 3 for a complete list of statistical test, test statistic and degrees of freedom for Fig. 3; see also Supplementary Fig. 6b. *P < 0.05 and **P < 0.01

