Fig. 4.
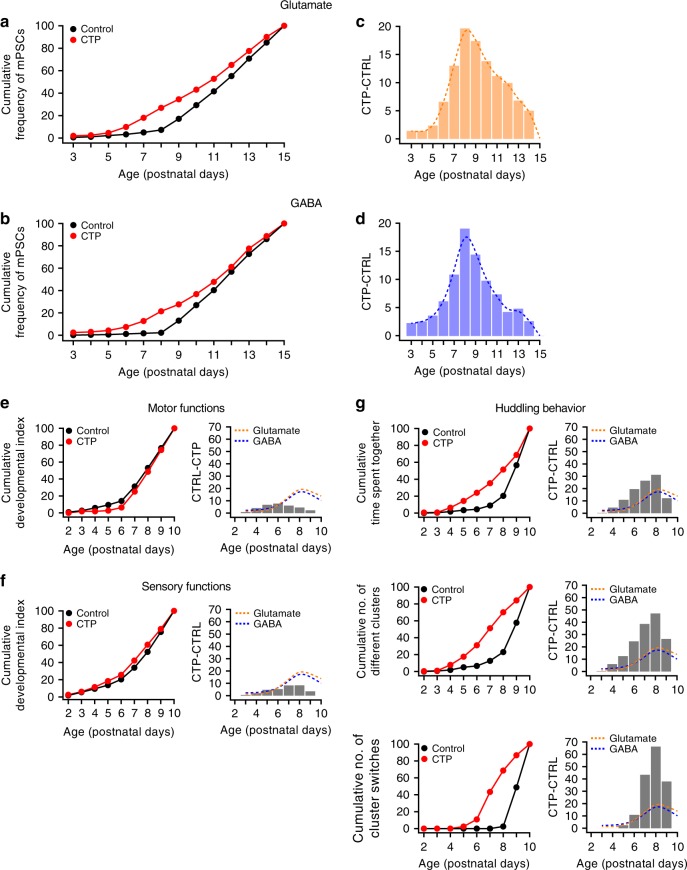
Blockade of 5-HT reuptake at early postnatal ages in vivo anticipates the temporal development of synaptic currents and the onset of huddling. a, b Cumulative developmental curves of the average frequencies of glutamatergic (a) and GABAergic (b) mPSCs from animals that were treated systemically with CTP (red, N = 86 cells from 13 animals) vs controls black traces (from Fig. 1b). c, d Bar plot showing the difference between the CTP and control cumulative curves for each postnatal day; dashed lines represent the polynomial fit of the difference distribution of glutamatergic (orange) and GABAergic (blue) mPSCs. The maximal separation between the control and the CTP cumulative curves was observed at P8 both for glutamatergic and GABAergic mPSCs. e, f Left panels: Cumulative developmental curves of motor and sensory functions. The CTP treatment did not alter the time course of the onset of motor and sensory functions (statistical interaction between the factors ‘treatment’ and ‘postnatal age’ after a two-way ANOVA of ranks was not significant for motor (F(8,108) = 0.29, P > 0.05) and sensory functions (F(8,198) = 0.87, P > 0.05); N = 5 litters, 50 animals total for CTP, and data for control from Fig. 2b). In (e), values from control were subtracted from CTP values to obtain positive differences. The cumulative curve for controls was calculated from the data presented in Fig. 2b. Right panel: bar plot showing the difference between the CTP and control cumulative curves for each postnatal day (gray bars). Bar plots were overlapped to dashed lines representing the differences observed for glutamatergic and GABAergic mPSC curves calculated in c and d for direct comparison. g Same as e and f, but for the three parameters describing the huddling behavior. For all parameters, the maximal difference between cumulative curves was observed at P8. Dotted lines represented the curves in c and d reported for direct comparison

