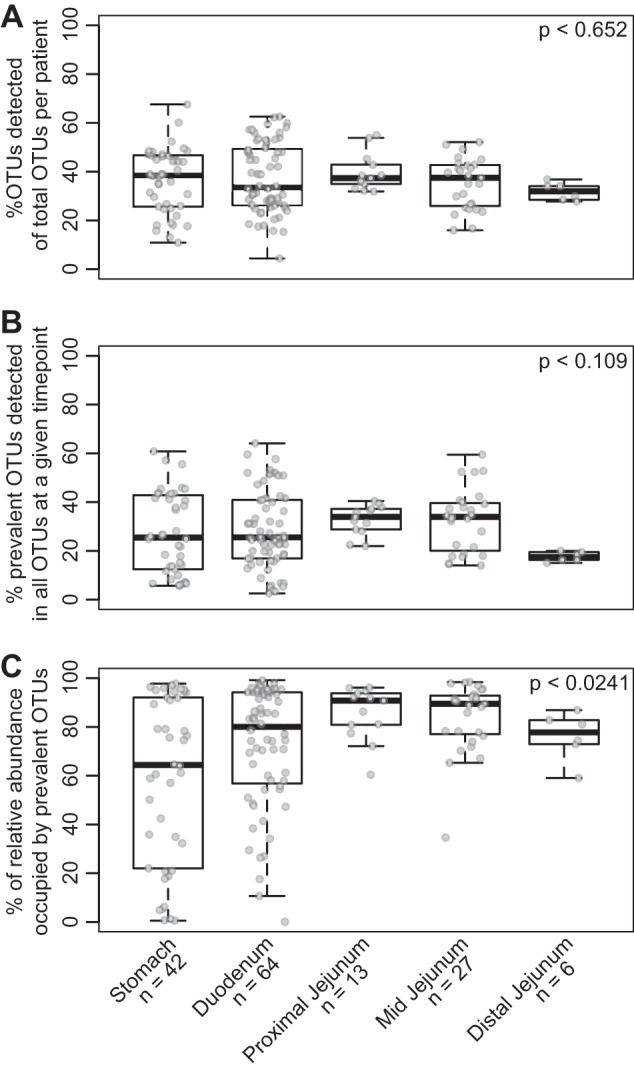
FIG 3.

Fluctuations in prevalent OTUs observed within an individual across the proximal GI tract. (A) Box plots of the percentage of OTUs detected in a given sample out of all OTUs detected (all OTUs possible for that individual) at a subject site. (B) Box plots of the percentage of OTUs that were consistently detected at a subject site out of the total OTUs detected in a given sample. (C) The percentage of relative abundance explained by prevalent OTUs at a subject site in a given sample. Statistical analyses were performed with the Kruskal-Wallis test.
