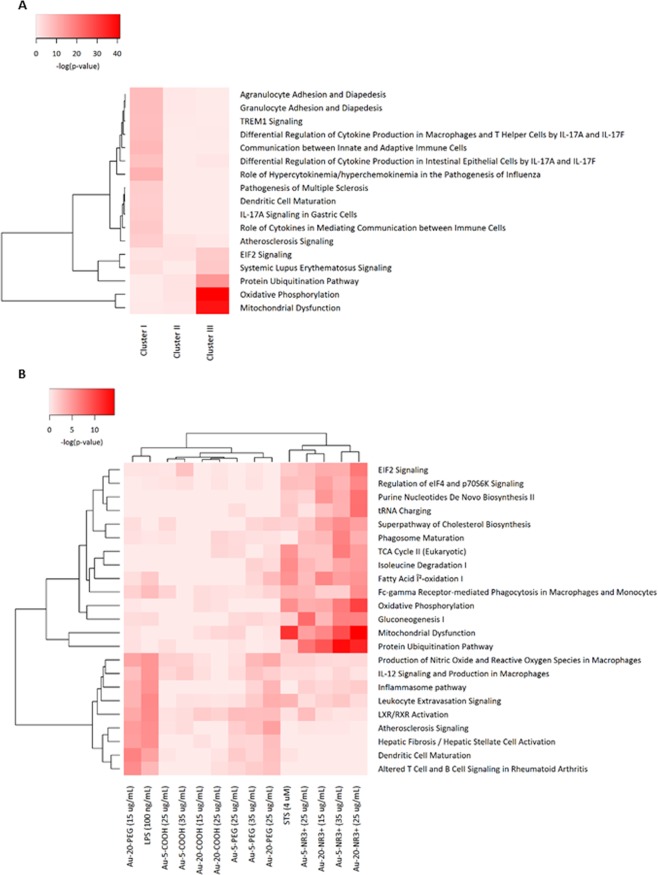
Figure 3.
Pathway analysis of transcriptomics and proteomics data. (A) The transcriptomics data were submitted to pathway analysis using the Ingenuity Pathway Analysis (IPA) software. The heatmap shows the canonical pathways associated with the 3 clusters of DEGs (refer to Supplementary Fig. S1). Values are normalized scores of the -log(p-value) with P < 0.00001 for at least one cluster. (B) Pathway analysis of the proteomics data. Refer to Supplementary Fig. S3 for an overview of the proteomics results. The heatmap shows the canonical pathways associated with the various treatments. STS and LPS were used as positive controls for cell death and cell activation, respectively. Values are scores of the -log(p-value) with P < 0.00001 for at least one treatment. Data displayed in panel A and B were analyzed through the use of IPA (QIAGEN Inc., www.qiagenbioinformatics.com/products/ingenuity-pathway-analysis).

