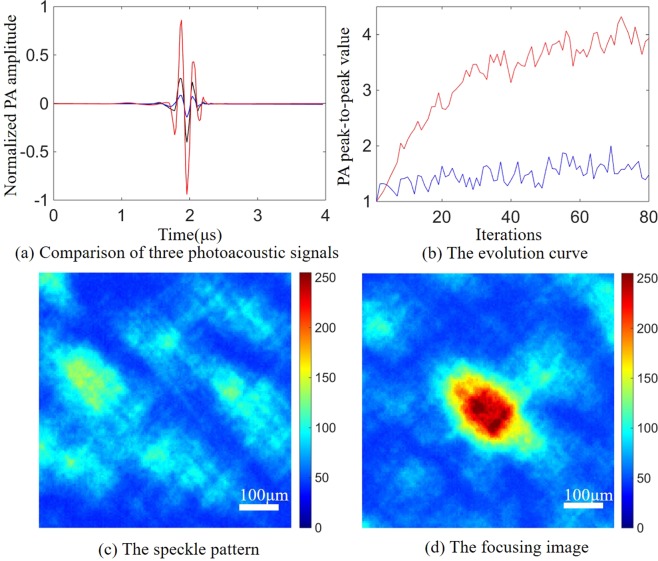
Figure 6.
Single-point focusing experiment. (a) Comparison of three photoacoustic signals. The blue line represents the corresponding photoacoustic signal when the DMD loads a random mask, and the black line represents the corresponding photoacoustic signal when the DMD pixels are fully turned on. The red line represents the photoacoustic signal of the optimal mask after optimization. (b) The evolution curves of the averaged fitness value in the evolution processes of the genetic algorithm. The red line indicates the result using wavelet denoising and correlation detection method, and the blue line indicates the signals only averaged. (c) The speckle pattern captured by the CCD before optimization. (d) The focusing image captured by the CCD after optimization.

