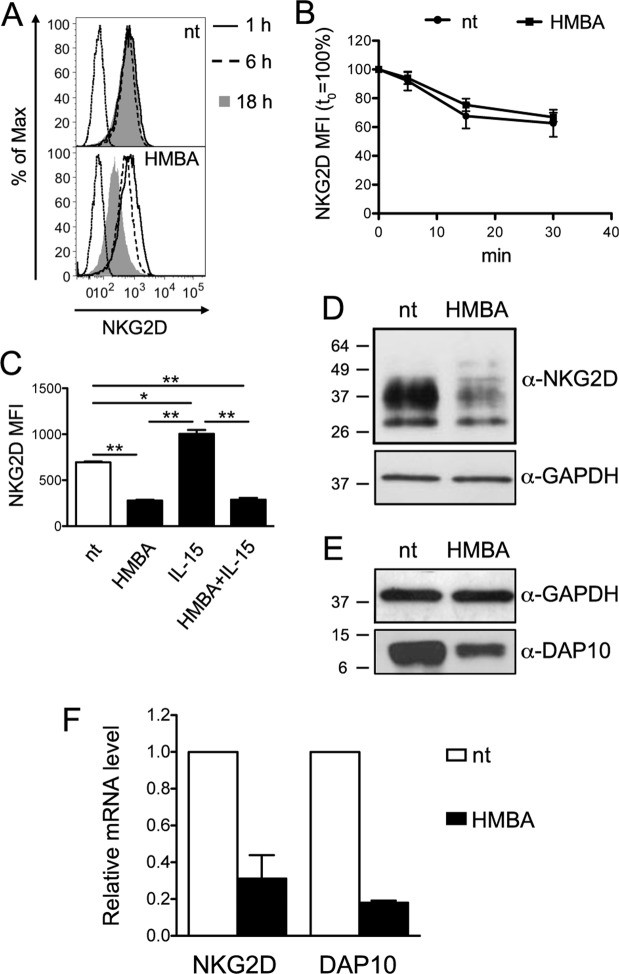
Figure 3.
HMBA affects NKG2D and DAP10 expression. (A) Cell-surface NKG2D expression on NK cells at various time points following HMBA treatment. Histograms show NK cells treated or not (nt) with 5 mM HMBA for 1 h (solid line), 6 h (dashed line) and 18 h (filled grey histograms) in one representative experiment out of three. (B) Kinetics of NKG2D internalization in NK cells treated or not with HMBA for 18 h. Mean ± SEM values of NKG2D MFI were calculated over time with respect to initial expression (set to 100%) in 3 independent experiments. (C) Intracellular NKG2D expression was measured in permeabilized NK cells following 18 h treatment with HMBA and 12.5 ng/ml of IL-15, either alone or in combination, as compared to nt cells. NKG2D MFI (mean ± SEM) in 3 independent experiments is shown. *P < 0.05, **P < 0.01 by two-tailed paired t test. (D,E) Equal amounts of total cellular lysate of NK cells treated or not with HMBA for 18 h were analyzed by western blotting with anti-NKG2D (D) or anti-DAP10 (E) antibodies as well as with anti-GAPDH mAb to confirm equal protein loading. Molecular mass standards (kDa) are indicated. One representative of four independent experiments is shown. Uncropped blots are presented in Supplementary Fig. S1. (F) Relative NKG2D and DAP10 mRNA levels in NK cells treated with HMBA compared with control nt cells was measured by Real-time qPCR. Shown are mean ± SEM from three independent experiments performed in triplicate.

