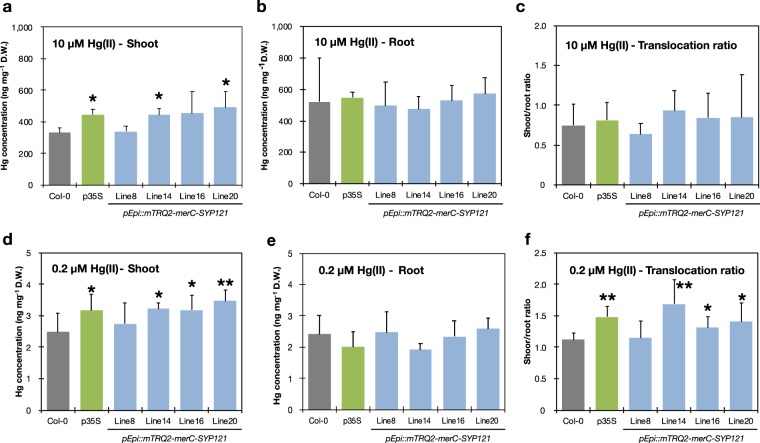
Figure 5.
Mercury accumulation in the pEpi plants. (a–c) Col-0 (wild-type), p35S (merC-SYP121 over-expressing line) and the pEpi lines were grown on the control agar medium for 10 d and then transferred to the medium containing 10 µM HgCl2 for 1 d. Mercury concentrations in shoots (a) and roots (b) were separately quantified by CV-AAS. Mercury translocation ratios (c) were calculated by dividing Hg concentrations of shoots by those of roots. Data represent means with SD (n = 4). Asterisks indicate significant differences from the values of Col-0 (*P < 0.05, Student’s two-tailed t test). (d–f) Col-0, p35S and the pEpi lines were grown on the agar medium containing 0.2 µM HgCl2 for 12 d. Mercury concentrations in shoots (d) and roots (e) and translocation ratios (f) were obtained. Data represent means with SD (n = 4–6). Asterisks indicate significant differences from the values of Col-0 (*P < 0.05, **P < 0.01, Student’s two-tailed t test).

