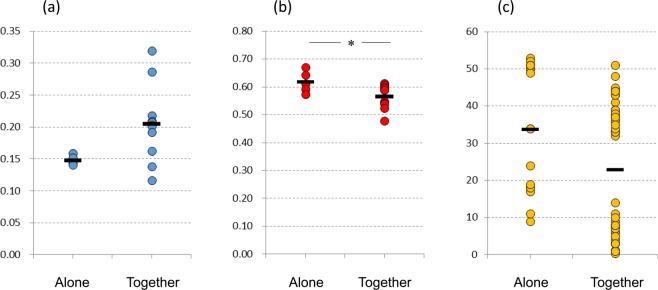
Figure 3.
Comparison of fecal microbiota similarity between family members taking a bath together (together group) and family members taking a bath alone (alone group). Weighted UniFrac distance of fecal microbiota between family members based on 16S rRNA gene analysis. This distance, representing the abundance of observed OTUs, reflects the similarity of the gut microbiota composition between subjects. (b) Unweighted UniFrac distance of fecal microbiota between family members based on 16 S rRNA gene analysis. This distance, based on presence or absence of each OTU, reflects the number of OTUs shared between subjects. Weighted and Unweighted UniFrac distances were analyzed by the unpaired t-test. (c) Subject age in each group.

