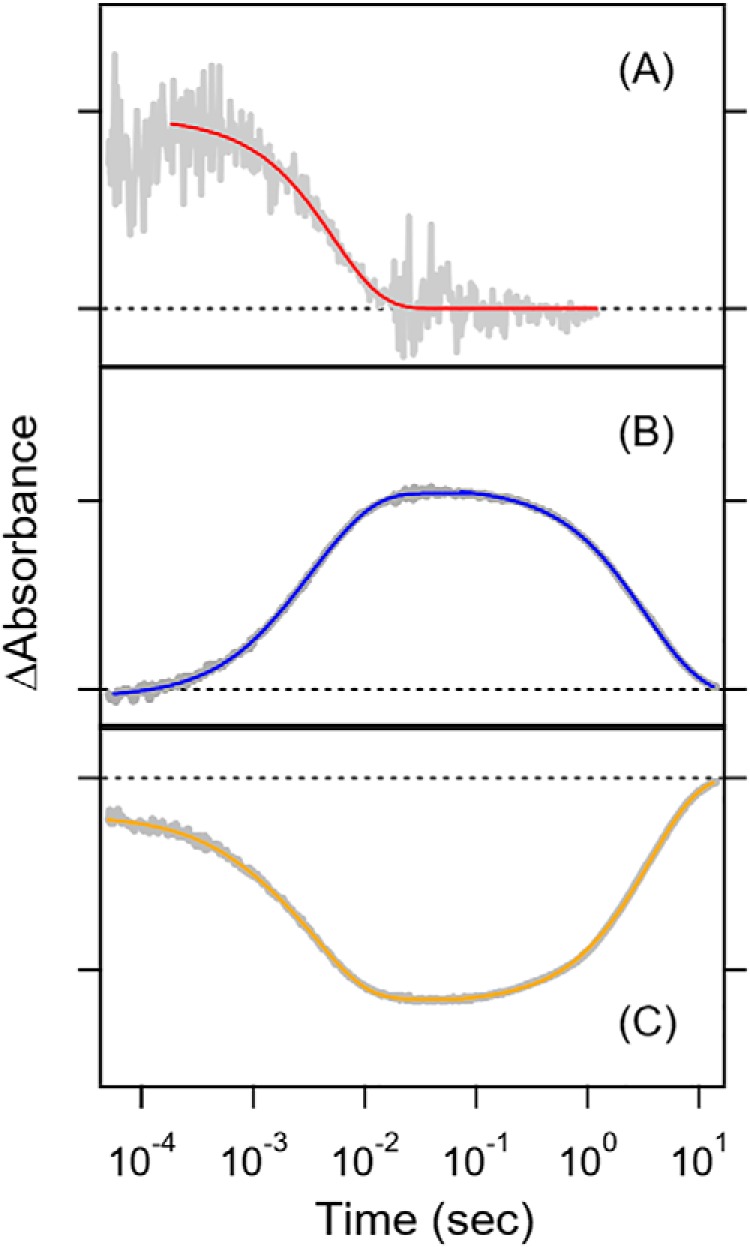
Figure 1.

Transient absorption of Rh-PDE(TMD) in detergent (0.03% DDM) at 600 nm (A), 400 nm (B), and 500 nm (C) after excitation at 490 nm. Gray lines represent the experimental data, whereas red (A), blue (B), and yellow lines (C) are the fitting curves. Broken lines show the zero line in each panel. One division of the y axis corresponds to 0.002 (A), 0.03 (B), and 0.03 (C) absorbance units.
