Figure 6.

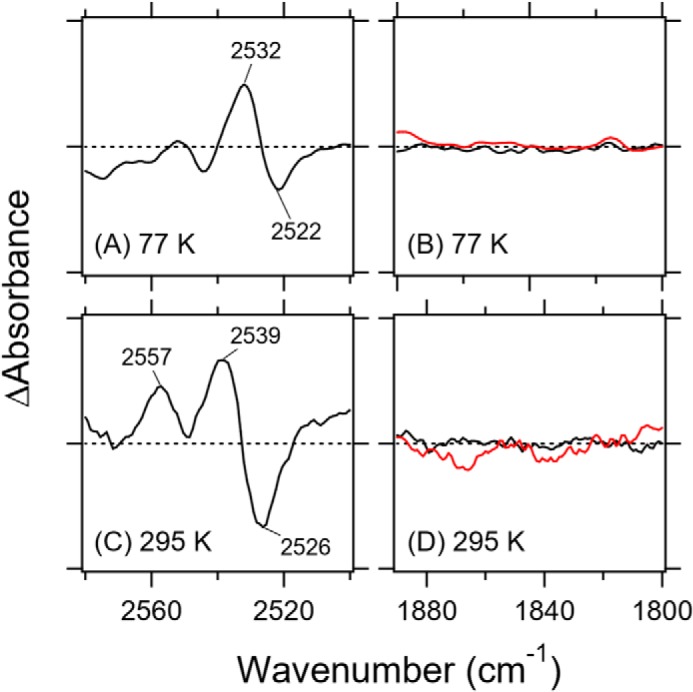
Difference FTIR spectra of Rh-PDE(TMD) in the S–H (A, 77 K; C, 295 K) and S–D (B, 77 K; D, 295 K) stretch region. Black and red lines represent the spectra in H2O and D2O, respectively.

Difference FTIR spectra of Rh-PDE(TMD) in the S–H (A, 77 K; C, 295 K) and S–D (B, 77 K; D, 295 K) stretch region. Black and red lines represent the spectra in H2O and D2O, respectively.