Figure 7.

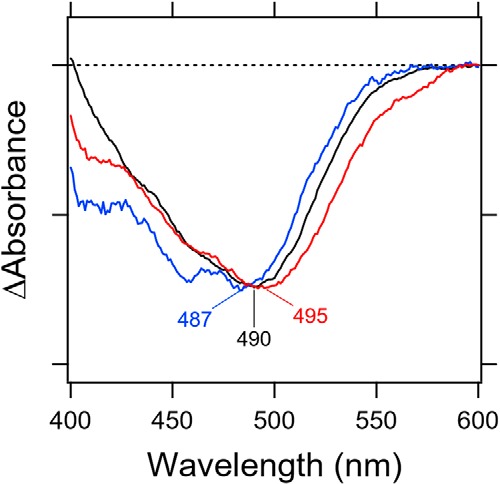
Light-induced difference absorption spectra of WT (black line), E164Q (blue line), and D292N (red line) of Rh-PDE(TMD) in the presence of 500 mm hydroxylamine bleach. Negative signals correspond to each absorption spectrum.

Light-induced difference absorption spectra of WT (black line), E164Q (blue line), and D292N (red line) of Rh-PDE(TMD) in the presence of 500 mm hydroxylamine bleach. Negative signals correspond to each absorption spectrum.