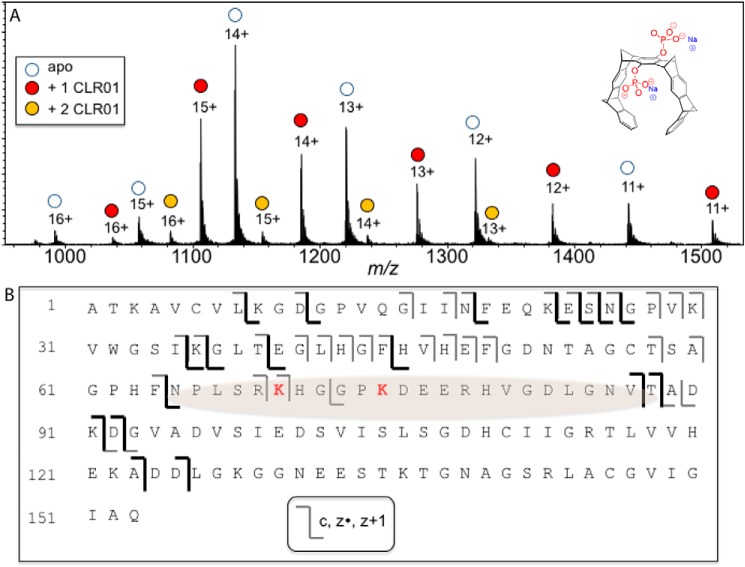
Figure 3.
Binding of CLR01 on SOD1 investigated by ESI-MS. A, ESI mass spectrum of a 10 μm SOD1/10 μm CLR01 mixture shows predominantly a 1:1 binding stoichiometry. The structure of CLR01 is shown at the top right corner. B, schematic of the ECD-MS/MS fragmentation profile for the 12+-charged 1:1 SOD1–CLR01 complex. Product ions that retained binding to CLR01 are shown in dark colored lines. From the fragmentation profile, the shaded region is suggested to be the site(s) of CLR01 binding.

