Figure 6.
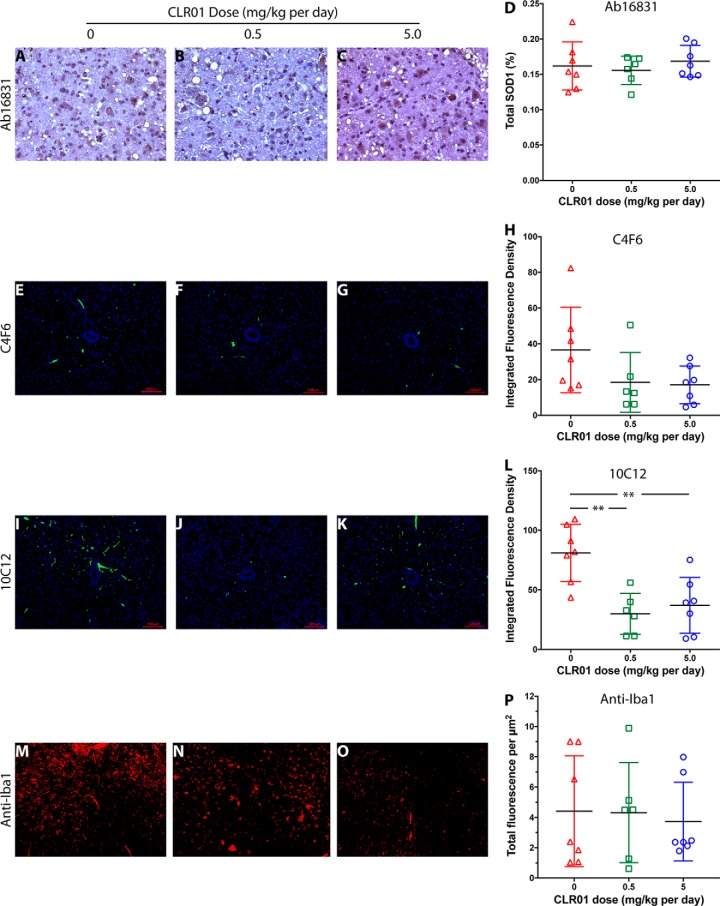
Analysis of SOD1 and microglia in mouse spinal cord. Lumbar spinal cord sections from euthanized mice were analyzed by IHC. A–C, representative images of pAb 16831, a pan-SOD1 antibody, staining for total mouse and human SOD1 in vehicle-treated (A), 0.5 mg/kg (B), and 5.0 mg/kg (C) CLR01-treated mice. D, quantitative analysis of pAb 16831 staining. E–H, representative images of mAb C4F6, which stains specifically apo G93A-SOD1 in vehicle-treated (E), 0.5 mg/kg (F), and 5.0 mg/kg (G) CLR01-treated mice. H, quantitative analysis of mAb C4F6 staining. I–L, representative images of mAb 10C12, which stains specifically early-forming species of misfolded SOD1 in vehicle-treated (I), 0.5 mg/kg (J), and 5.0 mg/kg (K) CLR01-treated mice. L, quantitative analysis of mAb 10C12 staining. M–P, representative images of anti-Iba1 pAb, which stains microglia in vehicle-treated (M), 0.5 mg/kg (N), and 5.0 mg/kg (O) CLR01-treated mice. P, quantitative analysis of anti-Iba1 staining. The scale bars in E–G and I–K denote 100 μm and are applicable also to M–O. **, p < 0.01, one-way ANOVA with post hoc Tukey test.

