Figure 4.
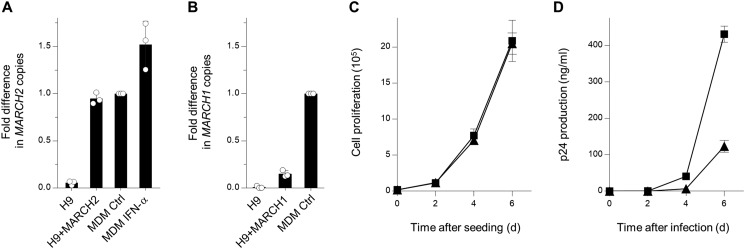
A, CD4-positive H9 cells were transfected with a MARCH2 expression plasmid carrying a neomycin-resistant gene and selected with G418; the resultant cells were cloned (H9+MARCH2). Cells were analyzed by real-time RT-PCR for MARCH2 expression. Note that the level of MARCH2 expressed in H9+MARCH2 is comparable with that endogenously expressed in MDMs. Data are shown as -fold difference in MARCH2 copies compared with those in the MDM control (mean ± S.D. from three independent experiments). B, MARCH1 stably expressed in H9 cells does not reach expression levels as those observed in MDMs. H9 cells transfected with MARCH1 expression plasmid were analyzed as shown in A. C, cell proliferation of control (squares) and MARCH2-expressing (triangles) H9 cells. The assay was started with 20,000 cells (mean ± S.D. from three independent experiments). D, multiple rounds of virus replication in H9 cells. Control H9 (squares) or H9+MARCH2 (triangles) cells (1 × 10⁵) were infected with 0.1 ng of p24 antigen of NL4–3 viruses. Supernatants were harvested at the indicated times, and virus replication was monitored using p24 ELISA. The data shown are representative of three independent experiments (mean ± S.D. of three technical replicates). d, days.

