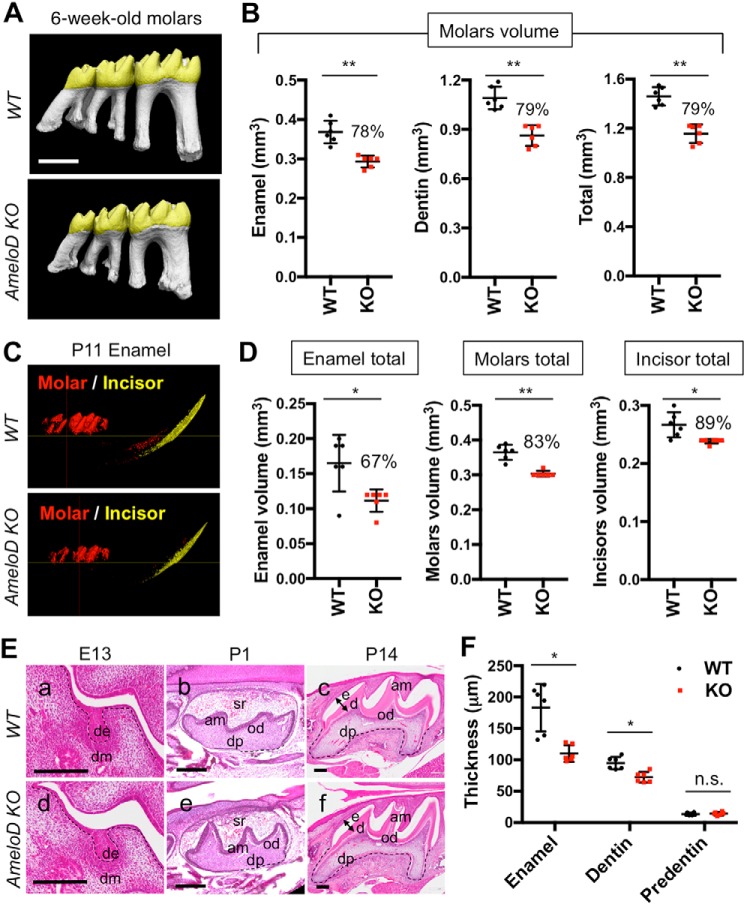
Figure 3.
Tooth phenotype analysis of AmeloD-KO mice. A, micro-CT analysis of 6-week-old WT and AmeloD-KO molars. B, the total volume of enamel and dentin in 6-week-old WT and AmeloD-KO molars (n = 6). The number above the bar graph is the ratio of the volume (KO/WT). The mean is shown as lines. Error bars represent S.D. **, p < 0.01 with a two-tailed t test. Scale bars, 1000 μm. C, micro-CT analysis of P11 AmeloD-KO and WT incisor enamel and molar enamel. Enamel is defined by density as more than 1300 mg of hydroxyapatite/cm3. D, left panel, total volume of enamel in P11 WT and AmeloD-KO incisor and molars. Middle panel, total volume of enamel and dentin in molars. Right panel, total volume of enamel and dentin in incisors. The ratio of the volume (KO/WT) is shown as the number above the bar graph (n = 6). Red, molar enamel; yellow, incisor enamel. The mean is shown as lines. Error bars represent S.D. *, p < 0.05; **, p < 0.01 with a two-tailed t test. E, H-E staining of developing WT (a–c) and AmeloD-KO (d–f) molars. Arrows indicate the position used for quantification of thickness in F. de, dental epithelium; dm, dental mesenchyme; sr, stellate reticulum; am, ameloblasts; od, odontoblasts; dp, dental pulp; e, enamel; d, dentin. The dashed lines indicate the border between the dental epithelium and mesenchyme. Scale bars, 200 μm. F, quantification of enamel, dentin, and predentin thicknesses from the P14 distal cusps of the lower first molars (arrows in E indicate the region of measurement; n = 6). The mean is shown as lines. Error bars represent S.D. *, p < 0.05 with a two-tailed t test. n.s., not significant.

