Figure 4.
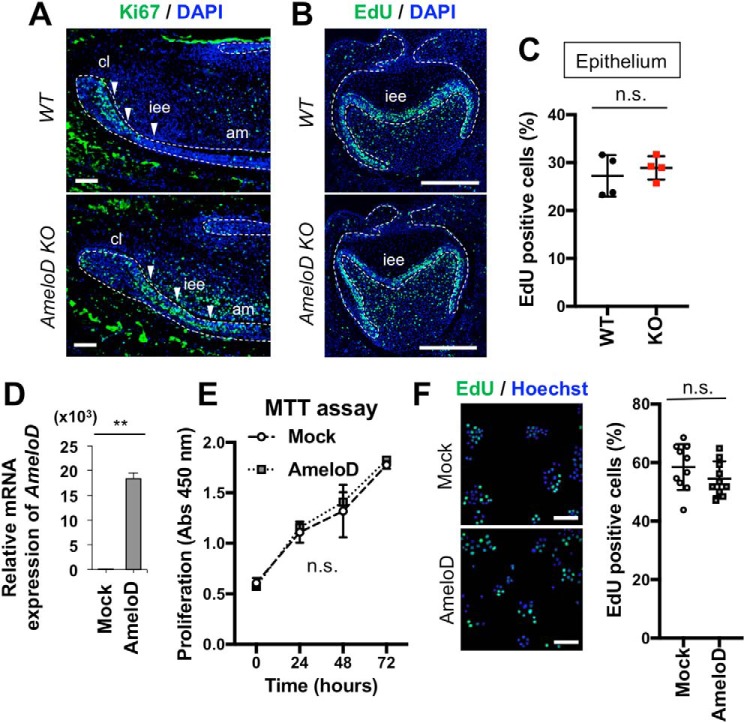
AmeloD has no effect on cell proliferation in IEE and in the CLDE dental epithelial cell line. A, immunostaining of Ki67 in P1 WT and AmeloD-KO incisors. Green, Ki67; blue, DAPI. Arrowheads indicate IEE cells. B, EdU staining of E18 WT and AmeloD-KO molars. C, quantification of EdU-positive cells. The EdU-positive ratio was calculated by counting the numbers of EdU-positive cells/stained nuclei in the epithelium. No significant difference was observed between WT and AmeloD-KO molars (n = 4). The mean is shown as lines. Error bars represent S.D. n.s., p > 0.05 with a two-tailed t test. D, AmeloD mRNA expression levels in AmeloD- and control mock vector–transfected CLDE cells (n = 3). Error bars represent S.D. **, p < 0.01 with a two-tailed t test. E, proliferation assay of AmeloD- and mock-transfected cells. The proliferation activity was detected as absorbance at 450 nm using a MMT kit (Dojindo; n = 3). Error bars represent S.D. n.s., p > 0.05 with two-way ANOVA. F, EdU incorporation and staining in AmeloD- and mock-transfected CLDE cells. Green, EdU; blue, Hoechst (n = 10). The mean is shown as lines. Error bars represent S.D. n.s., p > 0.05 with a two-tailed t test. Bars, 50 μm.

