Figure 5.
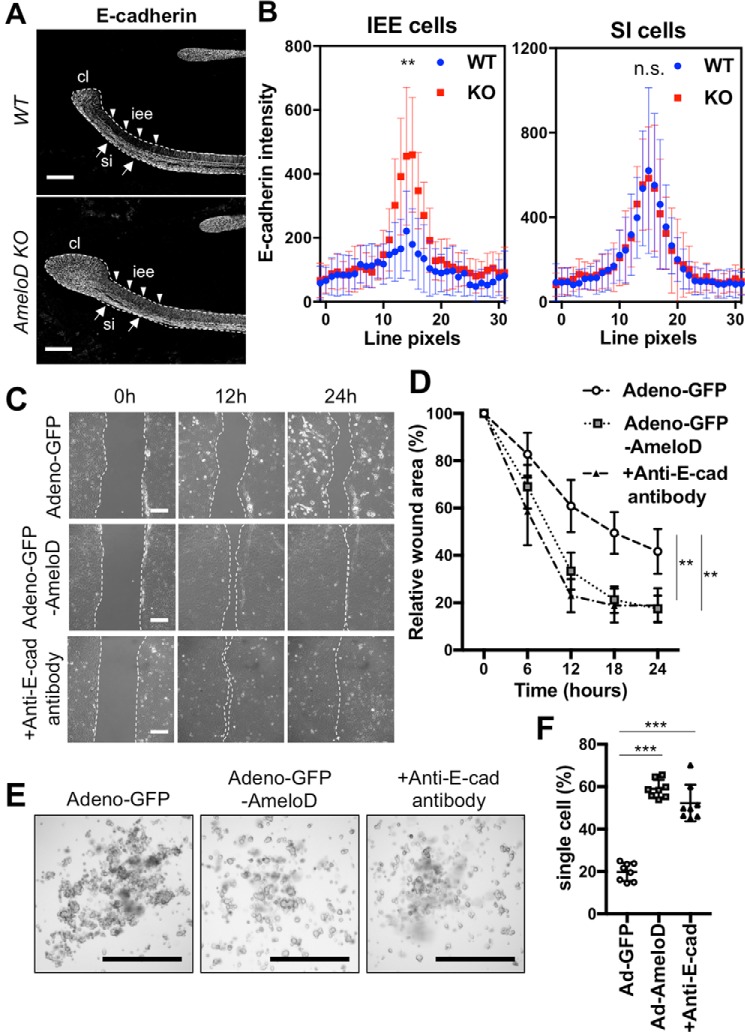
AmeloD inhibits E-cadherin expression in IEE and promotes cell migration in vitro. A, immunostaining of E-cadherin in P1 WT and AmeloD-KO incisors. White, E-cadherin. Arrowheads indicate IEE cells, and arrows indicate SI cells. cl, cervical loop; iee, inner enamel epithelium; si, stratum intermedium. The dashed lines indicate the border between the dental epithelium and mesenchyme. Scale bars, 200 μm. B, quantification of E-cadherin staining from 30-pixel-wide fluorescence line intensity scans across cell–cell junctions. SI cells were measured as an internal control (n = 20). The mean is shown as dots. Error bars represent S.D. **, p < 0.01 with one-way ANOVA. C, wound healing assays for the adeno-GFP– or the adeno-GFP-AmeloD–infected or anti-E-cadherin functional antibody–treated CLDE cells. Scale bars, 50 μm. D, cell migration and wound closure areas in the wound healing assay (n = 5). The mean is shown as dots. Error bars represent S.D. **, p < 0.01 with respect to the adeno-GFP as control by two-way ANOVA. E, hanging drop cultures of the adeno-GFP– or the adeno-AmeloD–infected or anti-E-cadherin (E-cad) functional antibody–treated CLDE cells. Cell spheroids in cultures 6 h after the cells were dropped. Scale bars, 1000 μm. F, single-cell ratio after passage through a cell strainer (n = 10). The mean is shown as lines. Error bars represent S.D. ***, p < 0.001 with respect to the adeno-GFP as a control by one-way ANOVA.

