Figure 2.
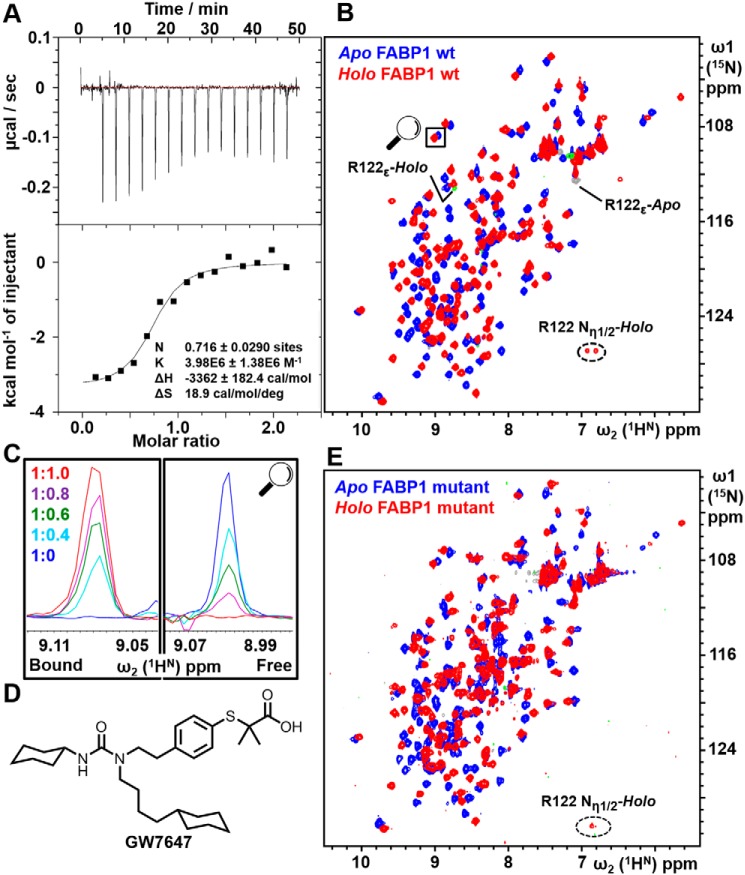
Analysis of GW7647 binding to FABP1. A, ITC titration of K57A/E77A/K96A triple-mutant FABP1 with GW7647. The upper panel shows the raw data from a single ITC experiment, and the lower panel shows the corresponding binding isotherm generated from the data fitted to a one-site binding model. B, 2D 15N HSQC of WT FABP1 in the absence (blue) and presence (red) of a saturating concentration of GW7647. Aliased peaks for Arg-122 that appear in the spectrum upon addition of GW7647 are labeled. C, cross-section of the highlighted peak upon titration of FABP1 with GW7647. The FABP1/GW7647 ratio of each spectrum is shown. The data indicate that the complex is in slow exchange on the NMR timescale where cross-peaks are observed in the titration whose intensity reflects the proportion of apo and holo FABP1. D, chemical structure of GW7647. E, 2D 15N HSQC of K57A/E77A/K96A triple-mutant FABP1 in the absence (blue) and presence (red) of a saturating concentration of GW7647.

