Figure 6.
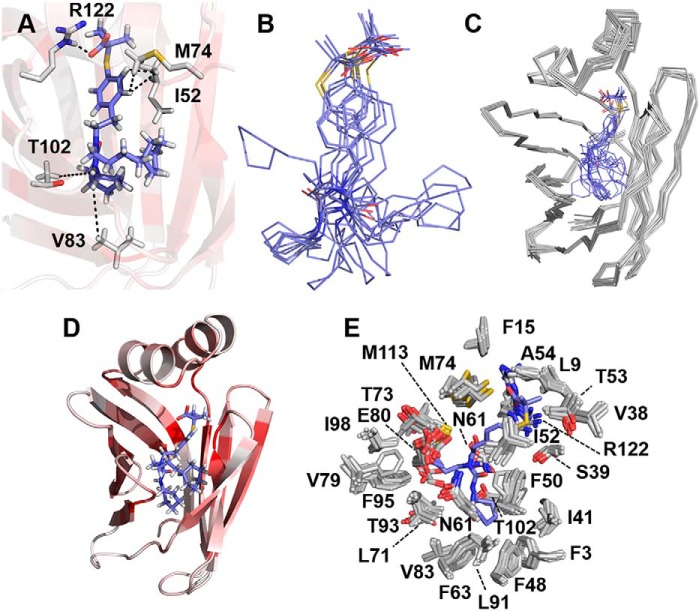
Solution structure of GW7647 bound to FABP1. A, binding mode of GW7647 represented by the conformer closest to the mean of the ensemble. NOE and H-bond constraints that were used for calculating the structure of the complex are indicated as dotted lines between the side chains of residues in FABP1 and GW7647. B, conformations of GW7647 in the ensemble of 10 conformers when bound to FABP1. C, ensemble of 10 conformers for the complex of GW7647 and FABP1. D, representative structure of the GW7647–FABP1 complex. The protein is shown as a cartoon and colored from white to dark red on a ramp with dark red representing residues having a chemical shift perturbation of ≥0.5 ppm in the 15N HSQC spectrum upon addition of GW7647. GW7647 is shown in stick representation with the carbon atoms colored blue. E, binding site for GW7647 in ensemble of 10 conformers representing the structure of FABP1 is represented with the protein side chains closest to the ligand shown as sticks with the carbon atoms colored white. The structure of GW7647 in the conformer closest to the mean of the ensemble is shown as sticks with carbon atoms colored blue.

