Figure 2.
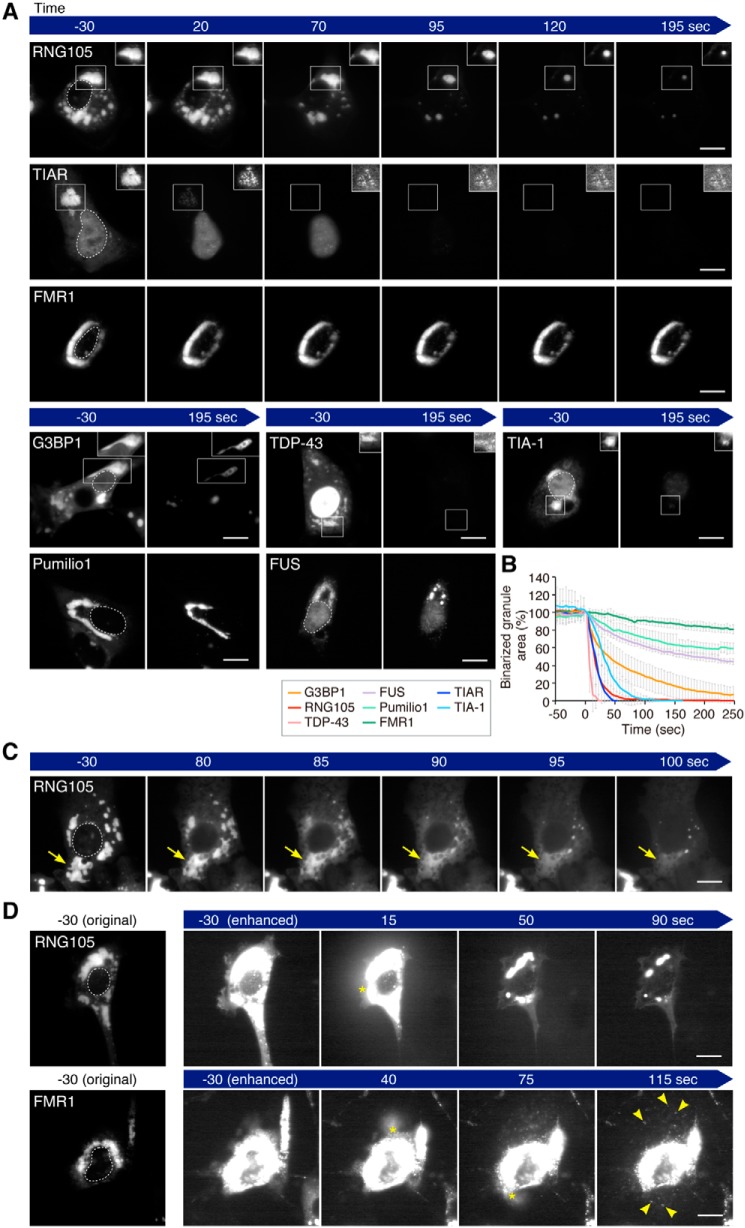
S- and R-granules exhibit different shape-change behavior after cell permeabilization. A, time-lapse images of scaffold-induced granules in the cell permeabilization analysis. Digitonin was added to the cells at time 0. Fluorescence levels in the boxed areas were adjusted using the automatic window/level tool of ImageJ to visualize the shapes of the granules regardless of the decrease in fluorescence in the granules after permeabilization, and the adjusted images are shown in the insets. The outlines of the nuclei are indicated by dotted lines in the left panels. Scale bars, 10 μm. B, area of binarized granules in the cell permeabilization analysis. Note that the time just before the cells became permeable was set to time 0, and the area of the binarized granules at time 0 was adjusted to 100%. n = 7 (G3BP1), 9 (RNG105), 8 (TDP-43), 7 (FUS), 8 (Pumilio1), 8 (FMR1), 8 (TIAR), and 8 (TIA-1) cells. C, representative image series of RNG105-induced granules to dissolve rapidly after cell permeabilization. Arrows indicate dissolution of a granule. D, representative image series of RNG105 and FMR1 blowing out from permeabilized cells. Asterisks indicate the positions of the blowout. RNG105-induced granules were dissolved in the medium, but FMR1-induced granules blew out from the cells as foci (arrowheads). Scale bars, 10 μm. See also Movies S1–S7.

