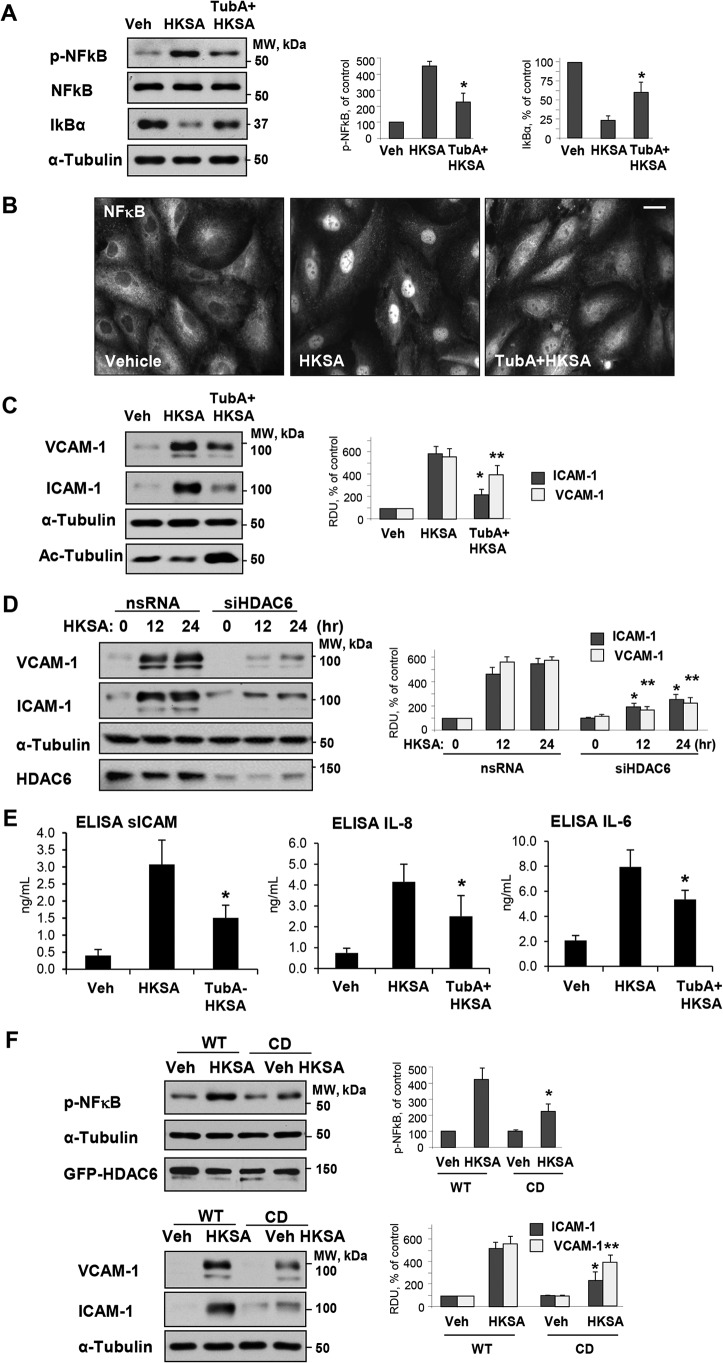
Figure 6.
HDAC6 inhibition prevents HKSA-induced EC inflammation. A, HPAEC were treated with HKSA in the presence or absence of TubA, and the levels of phospho-NF-κB, total NF-κB, and IκBα in cell lysates were detected by Western blot analysis. Equal total protein amounts were loaded on each lane; probing with α-tubulin was used as a confirmatory normalization control. Bar graphs depict quantitative densitometry analysis of phospho-NF-κB and IκBα levels. Results are shown as mean ± S.D.; n = 3, *, p < 0.05. B, HKSA-induced nuclear translocation of NF-κB (6 h) was evaluated by immunofluorescence staining with NF-κB antibody. Bar = 10 μm. Shown are representative images of three independent experiments. C, VCAM-1 and ICAM-1 expression in total cell lysates from HKSA-stimulated (24 h) HPAEC monolayers was monitored by Western blotting. Equal total protein amounts were loaded on each lane; membrane reprobing with α-tubulin antibody was used as an additional normalization control. Reprobing with antibody to acetylated tubulin was used to evaluate the efficacy of TubA to inhibit α-tubulin deacetylation. D, cells were transfected with HDAC6-specific or nonspecific siRNA followed by stimulation with HKSA for the indicated times and detection of VCAM-1 and ICAM-1 expression by Western blotting. Bar graphs depict a quantitative analysis of Western blotting densitometry data. Results are shown as mean ± S.D. n = 5; *, p < 0.05. E, cells were exposed to HKSA (24 h) with or without pretreatment with TubA, and levels of soluble ICAM (sICAM), IL-8, and IL-6 in conditioned medium were analyzed by ELISA. *, p < 0.05; n = 4. F, HPAEC were transfected with plasmids encoding GFP-tagged WT or CD-HDAC6 mutant followed by stimulation with HKSA at 24 h post-transfection. Phospho-NF-κB (top) or VCAM-1 and ICAM-1 (bottom) levels were determined by Western blotting. Equal total protein amounts were loaded on each lane; probing with α-tubulin was used as a confirmatory normalization control. Ectopic expression of HDAC6 constructs was verified by probing with GFP antibody. Bar graphs depict a quantitative analysis of Western blotting densitometry data and shown as mean ± S.D. n = 5; * p < 0.05. Veh, vehicle.

