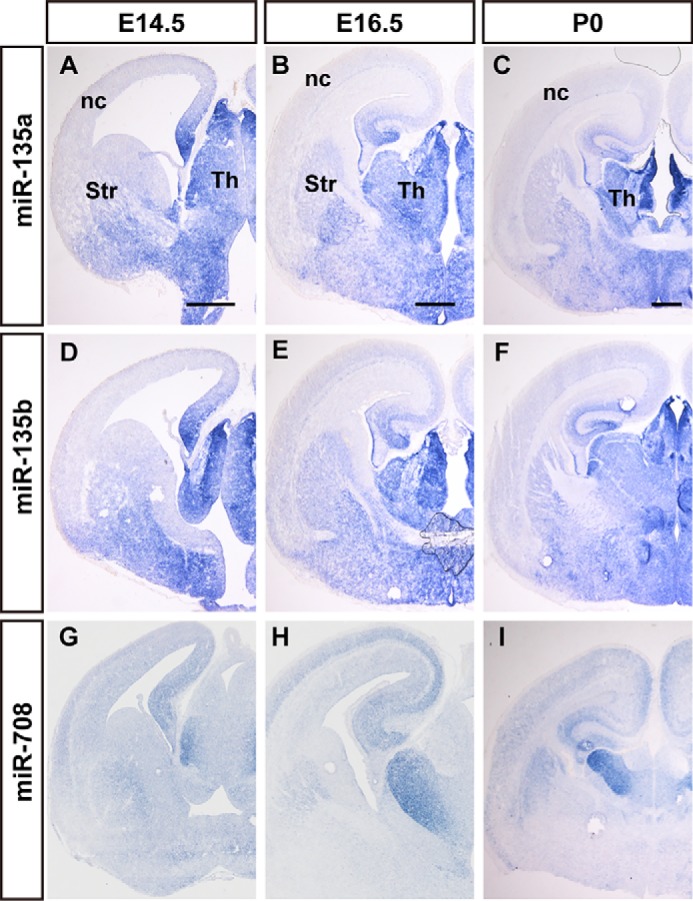
Figure 3.

The expression of thalamus-enriched miRNAs at E14.5 to E18.5 mouse brain. The dynamics of miR-135a (A–C), miR-135b (D–F), and miR-708 (G–I) expression in coronal sections of mouse brains during E14.5 (A, D, and G), E16.5 (B, E, and H), and E18.5 (C, F, and I), were performed by in situ hybridization. nc, neocortex; Str, striatum; Th, thalamus. Scale bars in A, D, and G are 500 nm, scale bars in B, E, and H are 500 nm, scale bars in C, F, and I are 500 μm.
