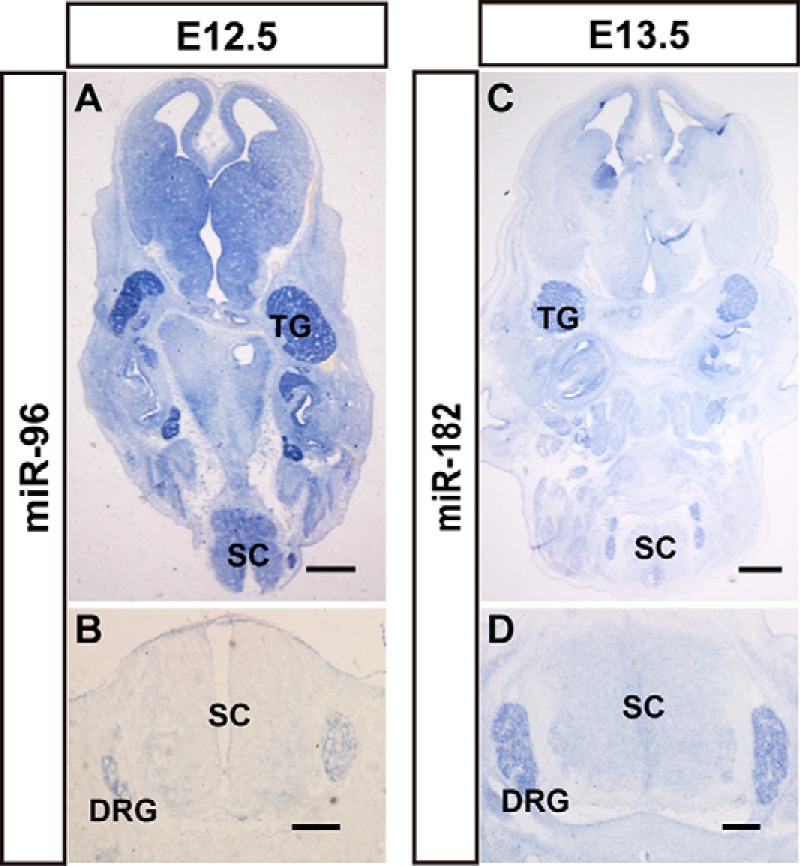
Figure 7.

miRNAs show enriched expression in the ganglion cells of the peripheral nervous system. The expression patterns of miR-96 (A and B) and miR-182 (C and D) in mouse brains, nerve ganglia, and spinal cord. The signal of miR-96 expression in horizontal sections of whole body (A) and spinal cord (B) at E12.5 is shown. The expression patterns of miR-182 in horizontal sections of whole body (C) and spinal cord (D) at E13.5 is shown. TG, trigeminal ganglia; SC, spinal cord; Scale bars in A and C are 500 μm, scale bars in B and D are 200 μm.
