Figure 5.
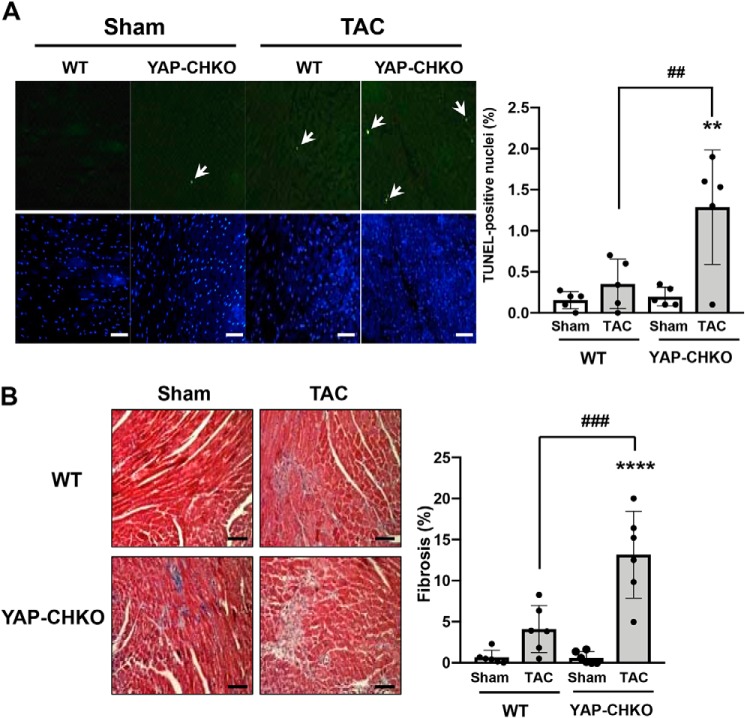
TAC-induced apoptosis and fibrosis were significantly increased in YAP-CHKO mice. WT and YAP-CHKO mice were subjected to either TAC or sham operation for 7 days. A, left, representative images of TUNEL staining and DAPI staining from each group. TUNEL-positive CMs are indicated by white arrows. Scale bars, 100 μm. A, right, number of TUNEL-positive CMs/the total number of nuclei. Values are mean ± S.D. n = 5. B, left, Masson's trichrome staining showing interstitial fibrosis. Representative images from each group are shown. Scale bars, 100 μm (right). The quantitative analysis of the fibrotic areas. n = 6. Values are the means ± S.D. ***, p < 0.0005; ****, p < 0.0001 versus shams. ##, p < 0.01; ###, p < 0.0005 in comparison with WT-TAC and YAP-CHKO-TAC. Statistical analyses were conducted with ANOVA. Post hoc analysis was conducted with Tukey's test.

