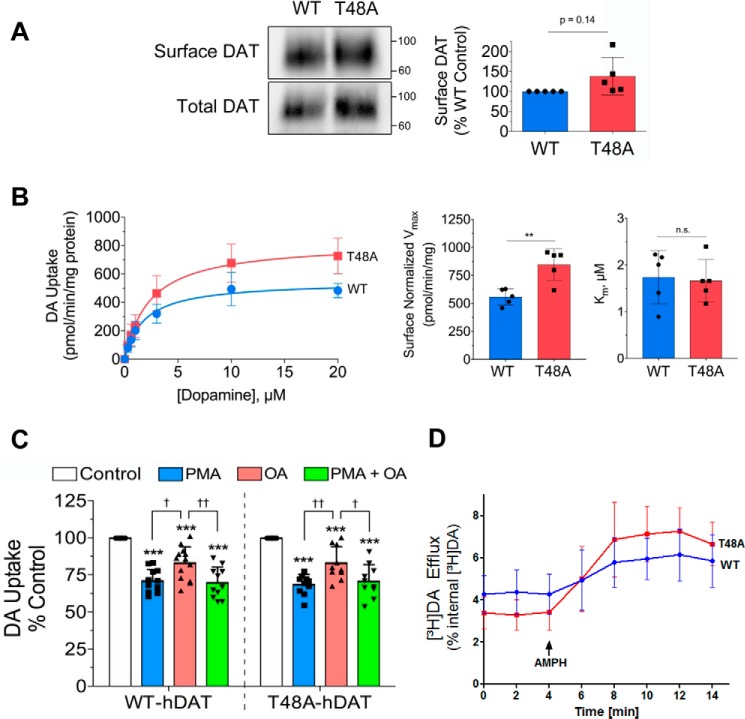
Figure 5.
Expression and kinetic analysis of the dephosphomimetic T48A-DAT. A, representative immunoblots showing comparative amounts of surface and total DAT levels in transfected LLC-PK1 cells (left). Surface and total expression of WT and T48A-DATs were analyzed in each experiment in parallel for DA uptake saturation analysis (B). B, saturation analysis (left) of [3H]DA uptake by WT and T48A-DATs in LLC-PK1 cells. Uptake values shown are the mean ± S.D. of five independent experiments performed in triplicate. The histograms show significantly increased Vmax values for the T48A mutant (middle) and no change in the Km (right) compared with the WT DAT (means ± S.D. (error bars); **, p < 0.01). C, LLC-PK1 cells transfected and expressing WT or T48A-DATs were treated with 0.4 μm PMA, 1 μm OA, or both for 30 min followed by a DA uptake assay. The bar graph shows the significantly decreased DA uptake by both WT and T48A-DATs with each treatment (means ± S.D.; ***, p < 0.001 versus control with the appropriate group; †, p < 0.05; ††, p < 0.01 for indicated pairs, n ≥ 10; ANOVA with Tukey post hoc test). D, amphetamine (AMPH)-stimulated DA efflux by WT and T48A-DATs in LLC-PK1 cells. The addition of AMPH at t = 4 min is indicated by an arrow. Data are means ± S.D. of three experiments performed in sextuplicate, p > 0.05, ANOVA with Tukey post hoc test).

