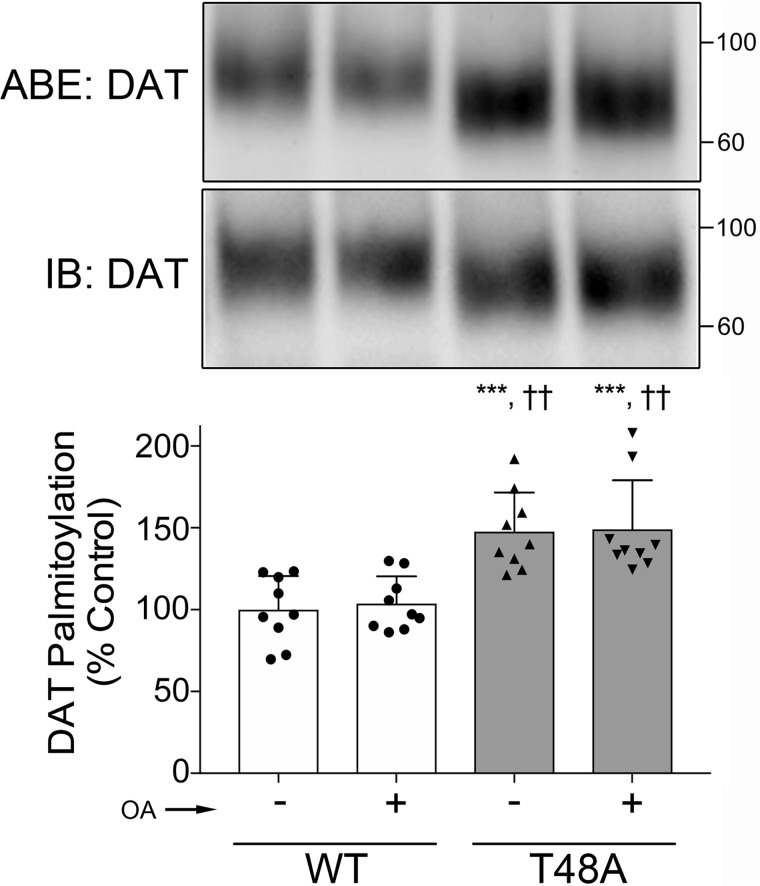
Figure 6.
Enhanced palmitoylation in the dephosphomimetic T48A-DAT mutant. LLC-PK1 cells expressing WT or T48A mutant DAT were treated with either vehicle (control) or 1 μm OA for 30 min, followed by assessment of DAT palmitoylation by ABE. Shown are representative immunoblots (top panel) with an anti-DAT antibody for NH2OH-treated ABE samples (top blots) and total cell lysates (bottom blots). The histogram (bottom panel) shows quantification of DAT palmitoylation (***, p < 0.001 versus WT control; ††, p < 0.01 versus WT plus OA; ANOVA with Tukey post hoc test). Error bars, S.D.

