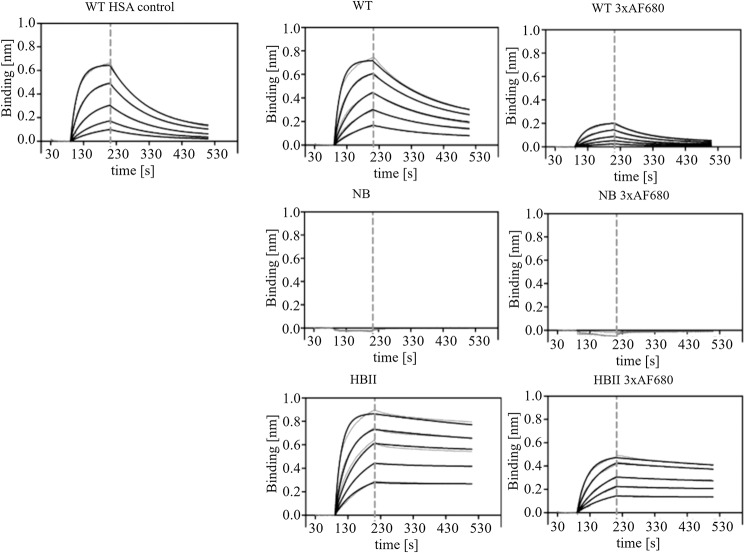
Figure 2.
Representative fitted binding affinity curves (black) from three replicates for triple-thiol rHSA variants binding to hFcRn from Biolayer Interferometry measurements. The two-fold dilution series from 3 to 0.1875 μm albumin is shown. Raw data curves are depicted in gray. The vertical dashed line indicates transition between association phase and dissociation phase. Top (left to right), standard WT HSA control (single-thiol), triple-thiol WT rHSA, and triple-thiol WT rHSA 3xAF680. Middle (left to right), triple-thiol NB rHSA and triple-thiol NB rHSA 3xAF680. Bottom (left to right), triple-thiol HBII rHSA and triple-thiol HBII rHSA 3xAF680.

