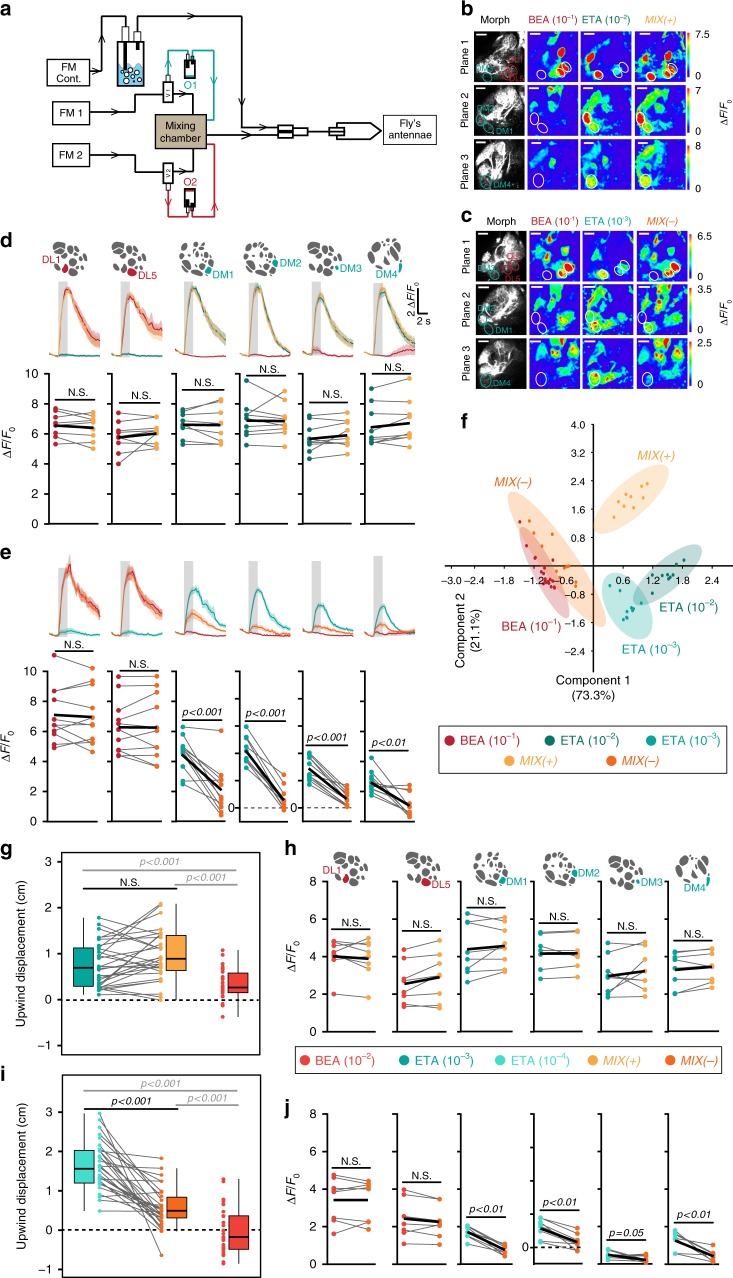
Fig. 2.
Glomeruli responding to the attractive odor reveal mixture inhibition. a Schematic of odor delivery system connected to 2-photon microscope. FM flowmeter, cont. continuous, O1/O2 odor 1/odor 2. b, c Representative odor-evoked calcium responses in PNs from three focal planes. Gray-scale images represent AL structure with identified glomeruli. Calcium responses are shown to ethyl acetate (10−2/10−3), benzaldehyde (10−1), MIX (+) and MIX(−). Scale bar = 20 µM. d Mean PN activity of strongest activated repellent-responsive (DL1, DL5, red) and attractant-responsive glomeruli (DM1, DM2, DM3, DM4, blue-green) during stimulation with ethyl acetate (10−2, blue-green), benzaldehyde (10−1, red) and their binary mixture (MIX(+), yellow). Odor responses of all annotated glomeruli (in total 34) are shown in Supplementary Fig. 2. Upper panel, averaged time traces of calcium signals with SEM (shadow); gray bar represents 2 s odor stimulation. Lower panel, mean fluorescence signals during odor stimulation; individual flies are given by single dots and lines; mean is indicated by black thick line (n = 9, paired t-test). Pairwise comparisons of mixture responses to the response of the strongest single component (i.e. either ethyl acetate or benzaldehyde) are shown for each animal. e Same as in d for ethyl acetate at 10−3 (bright blue-green), benzaldehyde (10−1, red) and MIX(−) (orange) (n = 11, paired t-test). f PCA of six most activated glomeruli during stimulation with the odors shown in b–e. Colored dots represent individual measurements. Shadows represent 95% ellipses for each odor. MIX(−) and benzaldehyde representations are not significantly different (one-way ANOSIM, Rho similarity index). g Box plots represent net upwind displacement in the FlyWalk within 4 s following stimulation with ethyl acetate (10−3, bright blue-green), benzaldehyde (10−2, bright red), and MIX( + ) (yellow). Colored dots and gray lines represent individual flies. (n = 30, Wilcoxon signed rank test). h Mean PN activity of strongest activated repellent- and attractant-responsive glomeruli during stimulation with the odors from g (n = 8, paired t-test). i Same data as in g with ethyl acetate at 10−4 (turquoise, n = 30, Wilcoxon signed rank test). j Mean PN activity of strongest activated repellent- and attractant-responsive glomeruli during stimulation with the odors from i (n = 8, paired t-test)

