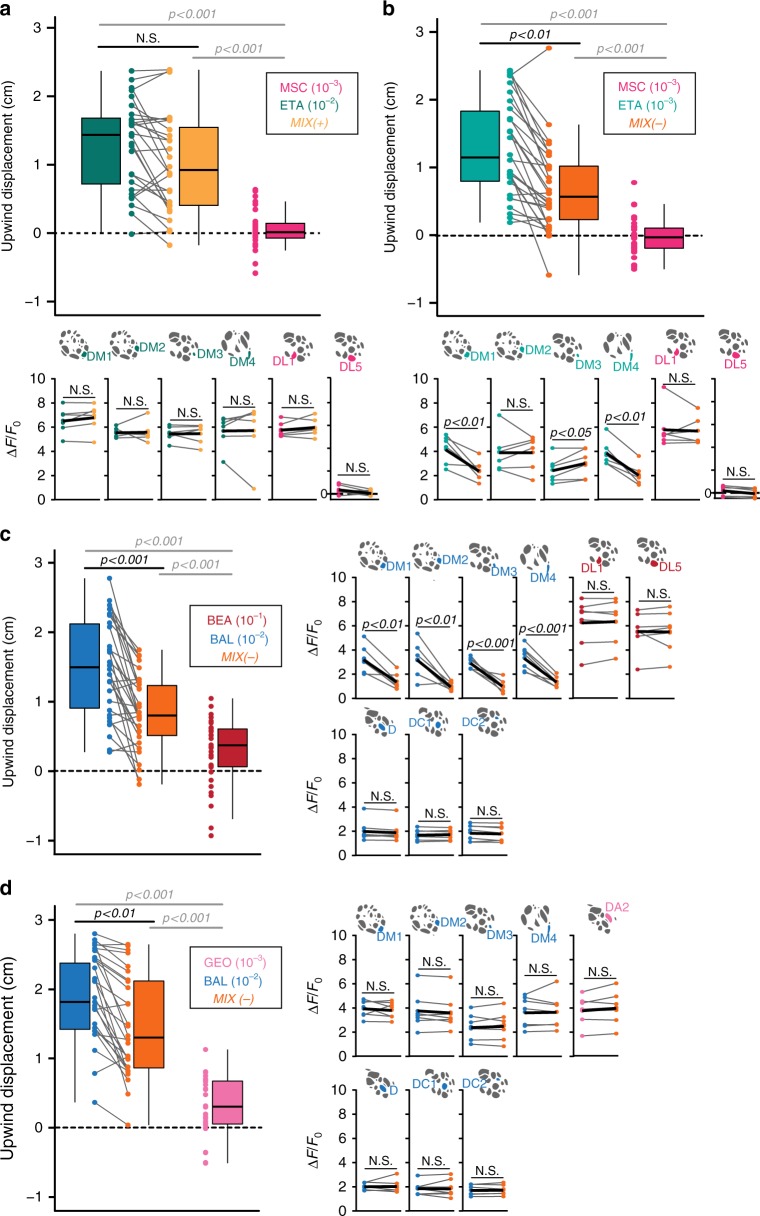
Fig. 3.
Different binary mixtures evoke glomerulus-specific inhibitions. a, b Upper panel, box plots represent net upwind displacement in the FlyWalk within 4 s following stimulation with ethyl acetate (10−2 and 10−3, blue-green/bright blue-green), methyl salicylate (10−3, magenta) and their binary mixtures (MIX(+) and MIX(−), yellow/orange). Colored dots and gray lines represent individual flies (n = 30, Wilcoxon signed rank test). Lower panel, mean PN activity of strongest activated attractant- and repellent-responsive glomeruli during stimulation with the odors from a or b, respectively (n = 6, paired t-test). c Left, box plots represent net upwind displacement in the FlyWalk within 4 s following stimulation with balsamic vinegar (10−2, blue), benzaldehyde (10−1, red), and their binary mixture (MIX(−), orange) (n = 30, Wilcoxon signed rank test). Right, mean PN activity of strongest activated attractant- and repellent-responsive glomeruli during stimulation with the odors used in the FlyWalk (n = 6, paired t-test). d Left, box plots represent net upwind displacement in the FlyWalk within 4 s following stimulation with balsamic vinegar (10−2, blue), geosmin (10−3, pink), and their binary mixture (MIX(−), orange; n = 30, Wilcoxon signed rank test). Right, mean PN activity of strongest activated attractant- and repellent-responsive glomeruli during stimulation with the odors used in the FlyWalk (n = 6, paired t-test). Odor responses to the different mixture combinations of all annotated glomeruli (in total 34) are shown in Supplementary Fig. 3

