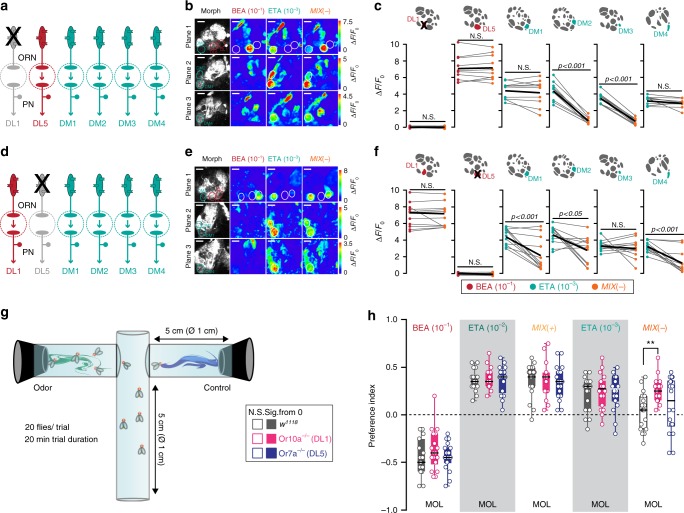
Fig. 4.
Selective silencing of input channels reveals glomerulus-specific inhibition. a Schematic of the experimental design: Or10a-expressing ORNs (targeting DL1) are not functional in a Or10a−/− mutant background. Color code indicates glomerulus-specific activation by the attractive (bright blue-green) or repellent (red) odor. b Representative odor-evoked calcium responses in PNs from three focal planes of Or10a−/− mutant fly expressing UAS-GCaMP6s in PNs. Gray-scale images represent the AL structure highlighting the attractant- (DM1, DM2, DM3, and DM4) and repellent-responsive glomeruli (DL1 and DL5) with colored circles. Calcium responses are shown to stimulation with ethyl acetate (10−3), benzaldehyde (10−1), and their binary mixture (MIX(–)). Scale bar = 20 µM. c Mean PN activity of repellent- and attractant-responsive glomeruli during stimulation with ethyl acetate (10−3, bright blue-green), benzaldehyde (10−1, red), and MIX(−) (orange) in Or10a−/− mutant flies. Individual flies are given by individual dots and lines; mean is indicated by black thick line (n = 10, paired t-test). Pairwise comparisons of mixture responses to the response with the strongest single component (i.e. ethyl acetate or benzaldehyde) are shown for each animal. d Schematic of the experimental design: Or7a-expressing ORNs (targeting DL5) are not functional in a Or7a−/− mutant background. Color code indicates glomerulus-specific activation by the attractive (bright blue-green) or repellent (red) odor. e Representative gray-scale and pseudcolored images of odor-evoked calcium responses in PNs from three focal planes of a Or7a−/− mutant fly expressing UAS-GCaMP6s in PNs. Calcium responses are shown to stimulation with ethyl acetate (10−3), benzaldehyde (10−1), and their binary mixture (MIX(−)). Scale bar = 20 µM. f Mean PN activity of repellent- and attractant-responsive glomeruli during stimulation with ethyl acetate (10−3, bright blue-green), benzaldehyde (10−1, red), and MIX(−) (orange) in Or7a−/− mutant flies (n = 12, paired t-test). g Schematic of the T-maze assay. h Box plots showing behavioral preference indices in the T-maze of Or10a−/− mutant (pink), Or7a−/− mutant (purple), and w1118 flies (gray) to the odors benzaldehyde (10−1), ethyl acetate (10−2/10−3), MIX( + ), and MIX(−) against the solvent control (MOL). (n = 15–19, one-way ANOVA with posthoc Tukey test, **p < 0.01). Filled boxes are significantly different from zero, empty boxes not (Student’s t-test)

