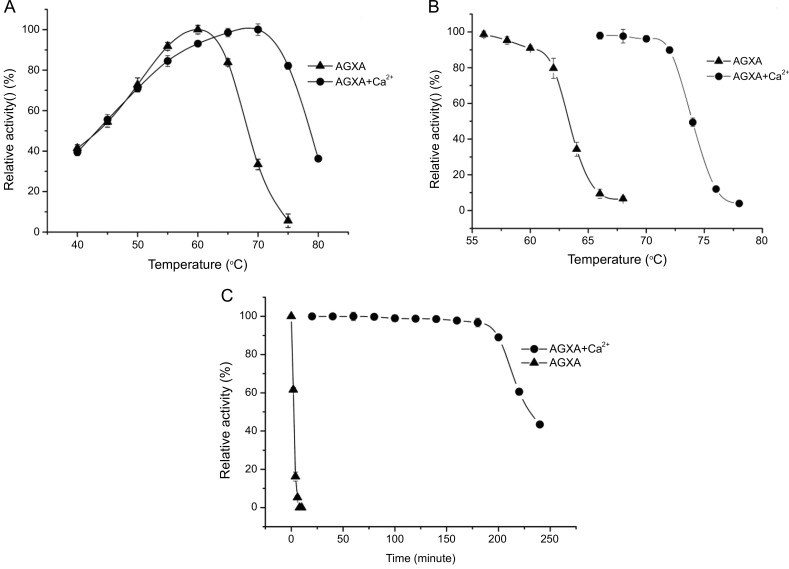
Figure 3.
The optimal temperature curves (A), and stability curves (B), the inactivation curves at 70 °C of AGXA with Ca2+ and without Ca2+ ions (C). The optimal temperature curves were determined by measuring the enzymatic activities at a temperature range of 40–80 °C with 5 °C intervals. The stability curves were determined by measuring the enzymatic activity after treatment from 60 to 80 °C (with 2 °C steps) for 30 min following a 10-min incubation on ice. Inactivation curves were determined by incubating enzymes at 70 °C and enzymatic activities were measured at various time points. Error bars were obtained from the standard deviation of triplicates.

