
Fig. 4.
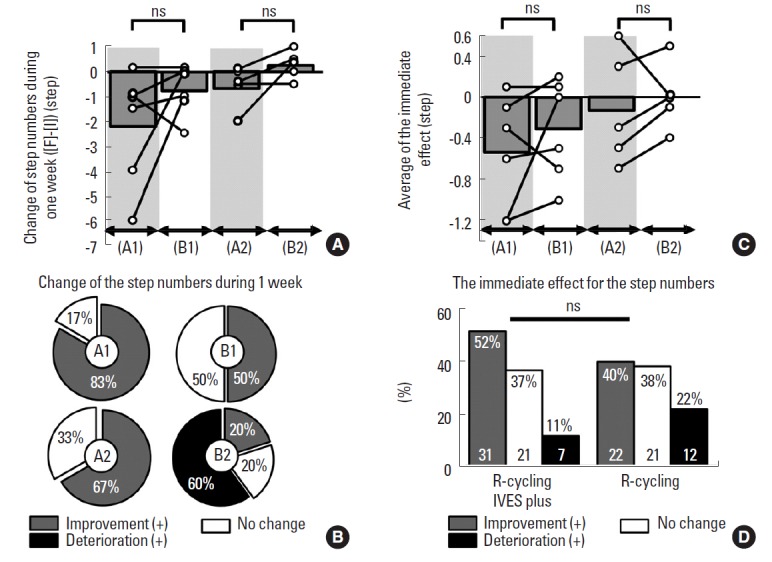
Change in the number of steps on the 10-m walking test before and after each weekly set. (A) The average weekly change in the number of steps numbers is shown (not significant [ns]). (B) The weekly changes in the number of steps numbers are shown as pie graphs, in terms of improvement, no change, and deterioration. (C) The immediate effects of the intervention on the number of steps are shown (ns). (D) The immediate effects of the intervention on the number of steps are shown in terms of improvement, no change, and deterioration. A1 and A2, the first and second sets of IVES-P mode with R-cycling, respectively; B1 and B2, the first and second sets of R-cycling alone, respectively; IVES-P, integrated volitional control electrical stimulation in the power assist.