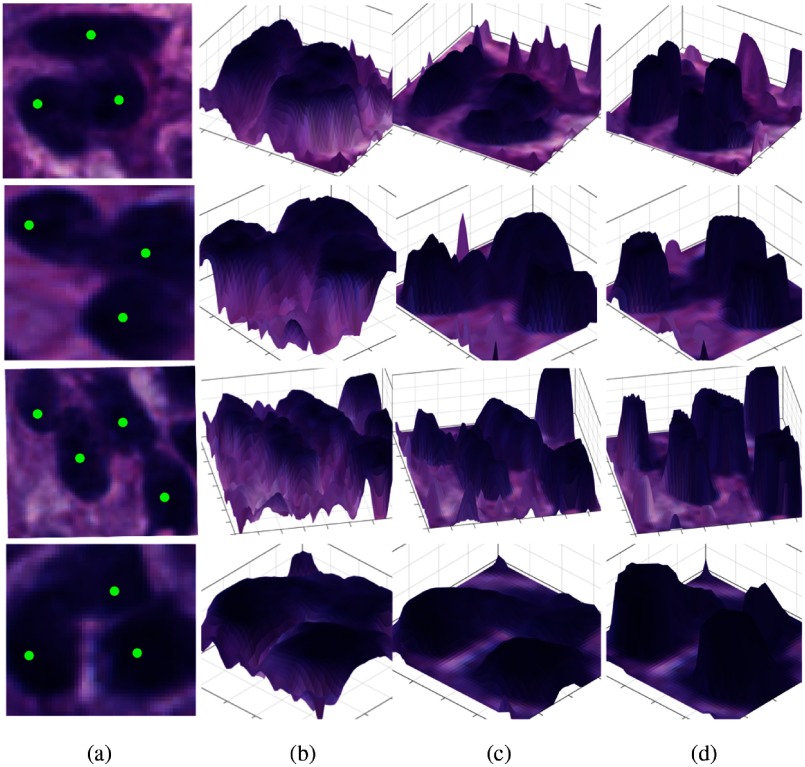
Fig. 3.
Analysis results of typical examples of overlapped nuclei with distinct overall clump shapes are presented at different steps. (a) Clumped nuclei instances with distinct overall shapes; (b) 3-D illustration of complementary image of decomposed hematoxylin signal surface overlaid with original image; (c) 3-D illustration of the difference image surface after background normalization; and (d) 3-D illustration of voting map after eigenvalue sign analysis.

