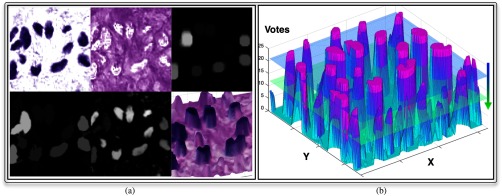
Fig. 4.
Voting map derived from a typical image region is demonstrated. (a) Top: the deconvolved hematoxylin channel, eosin channel, marker image; bottom: reconstructed, difference, and voting map surface overlaid with original image. (b) Illustration of the voting peak detection by sliding down an imaginary horizontal plane that intersects with the voting surface.

