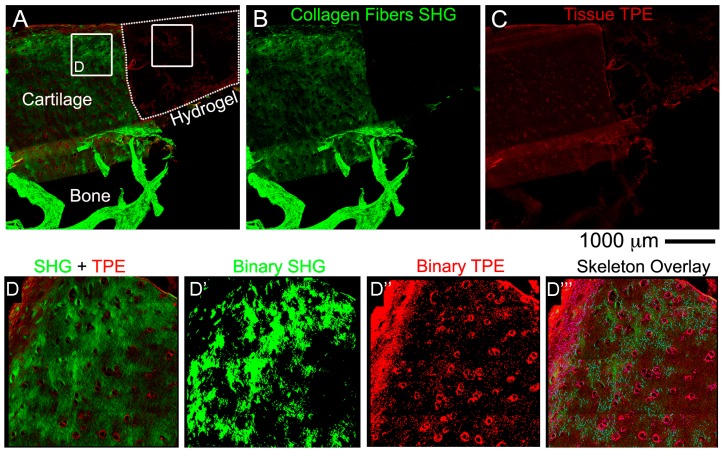
Figure 6.
Representative image acquired with non-linear microscopy using the Genesis system on unlabelled 10 µm cryosections. The super-imposed signals of second harmonic generation (SHG) (green channel) and two-photon excitation (TPE) (red channel) are shown (A), while the single channels in (B,C). The 2 regions of interest (ROI)’s in the cartilage and hydrogel layers correspond to the regions where the FibroIndex™ analysis was performed. (D–D‴) Detail of the ROI of the cartilage area in A used to elaborate and obtain the parameters with FibroIndexTM software, which were listed in Table 2 (ROI cartilage).

