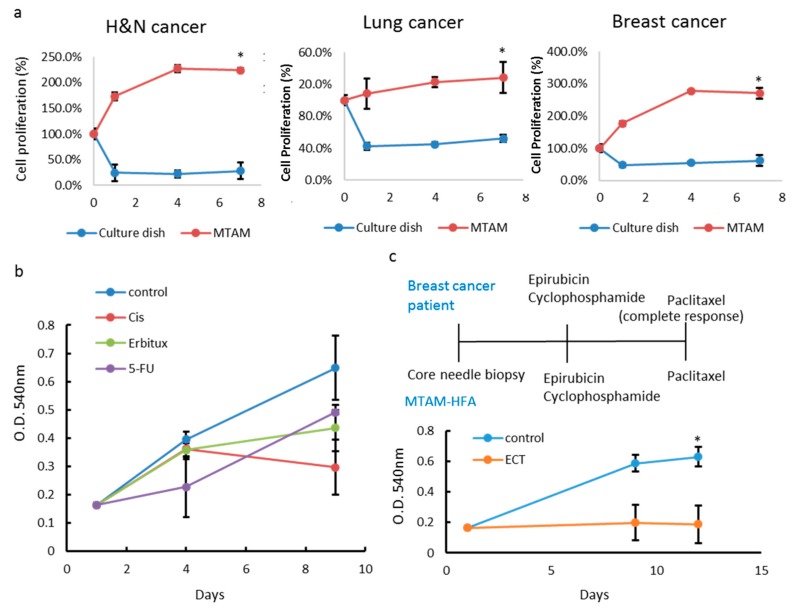
Figure 5.
PDTC models accurately replicate patient responses. (a) Graph depicting different tumor types growth in culture dish or MTAM to establish PDTC. (b) PDTC colon cancer models were screened by different type of anticancer drugs. (c) PDTC models were screened against the corresponding therapies received by the patient. Graphs show the average implanted cell viability for three to nine animals and SD. * Treated groups significantly different from untreated controls at the end point of the experiment (Student’s t-test; P < 0.05).

