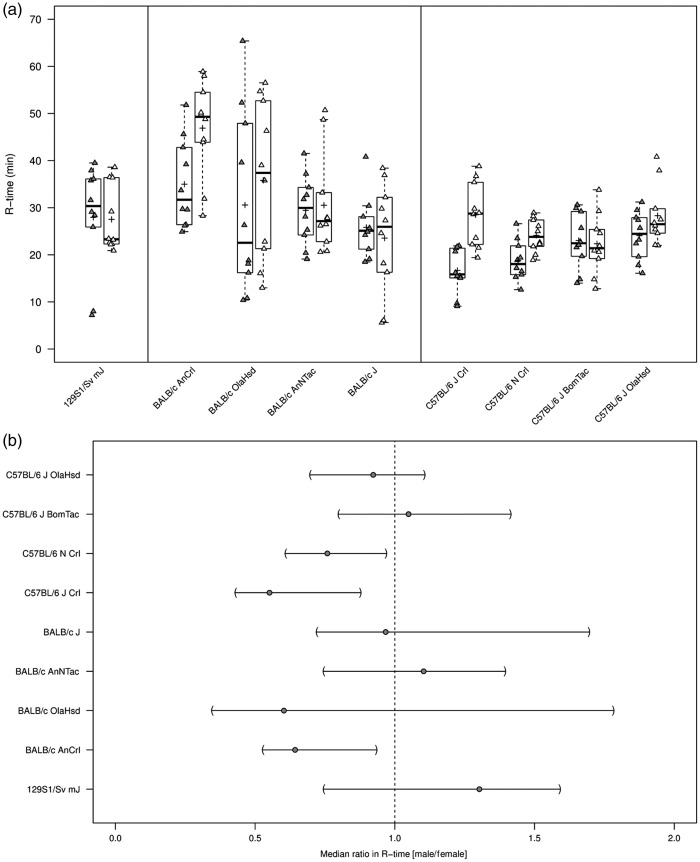
Figure 1.
Thromboelastography (R-time) in citrated whole blood from wild-type 129S1/Sv mJ, BALB/c, and C57BL/6 substrains. (a) R-time (min) summarized graphically by substrain and sex using boxplots (grey = males; white = females). Boxplots: The lower edge of the box represents the 25th percentile (or 1st quartile), the upper edge of the box represents the 75th percentile (or 3rd quartile), and the line within the lower edge and the upper edge of the box indicates the median. The distance from the lower edge to the upper edge of the box represents the inter-quartile range (IQR). A whisker is drawn above the 75th percentile to the largest data value that is less or equal to the value that is 1.5 × IQR above the 75th percentile. A whisker is drawn below the 25th percentile to the smallest data value that is less or equal to the value that is 1.5 × IQR below the 25th percentile. The cross represents the arithmetic mean. Individual measurements were added to the boxplots, where the exact horizontal position of plotting symbols was randomly determined. (b) The median ratio in R-time between sexes and corresponding two-sided 95% CIs for each substrain. A two-sided 95% CI for the ratio not containing the value 1 is equivalent to rejecting the null hypothesis of no difference against the two-sided alternative at the 5% level of statistical significance. Two-sided 95% CIs for should be interpreted with caution due to the small sample size per substrain and sex.

