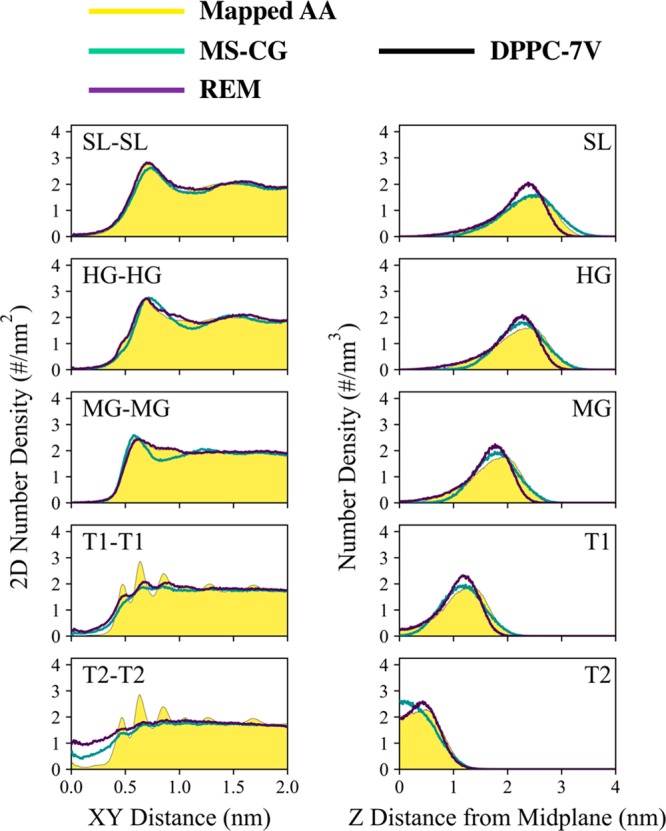
Figure 8.

Comparison of structural correlations in coarse-grained DPPC lipid bilayers between mapped all-atom trajectories, multiscale coarse-graining models (MS-CG), and relative entropy minimization (REM) models; here, only DPPC-7V results are shown. The left and right panels are lateral (i.e., xy-direction) and perpendicular (i.e., z-direction) number density profiles between the listed sites. Each of the profiles was averaged over both leaflets and used a bin size of 0.01 nm.
