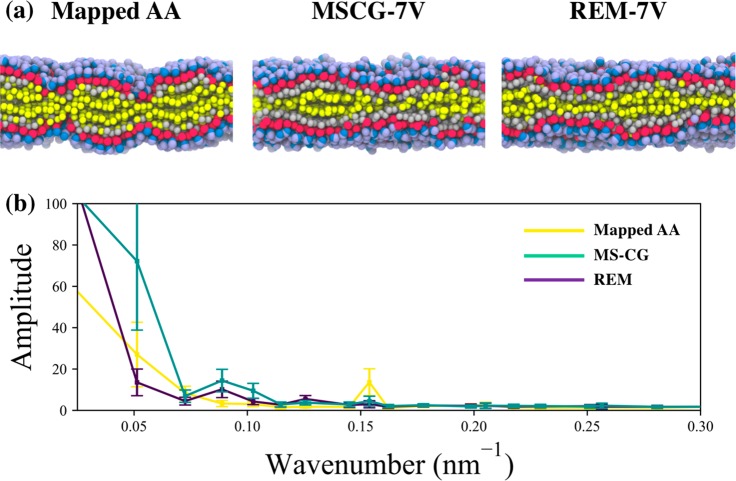
Figure 9.
(a) Lateral view snapshots of DPPC-7V from the mapped all-atom (AA) configuration, the MSCG-7V model, and the REM-7V model. Colors are consistent with Figure 1. (b) Comparison of amplitudes from the fast Fourier transform of the bilayer surface morphologies (taken with reference to the MG bead [red] height) generated by each model.

